|

EUR/GBP eyes bullish turn: A breach of 08600 could spark uptrend

  • EUR/GBP consolidates within a tilted downward bias, with key support at 0.8504.
  • The pair’s bullish turn hinges on a 0.8600 breach, testing 50-day EMA.
  • RSI is nearing bullish zone; RoC indicates a potential uptrend.

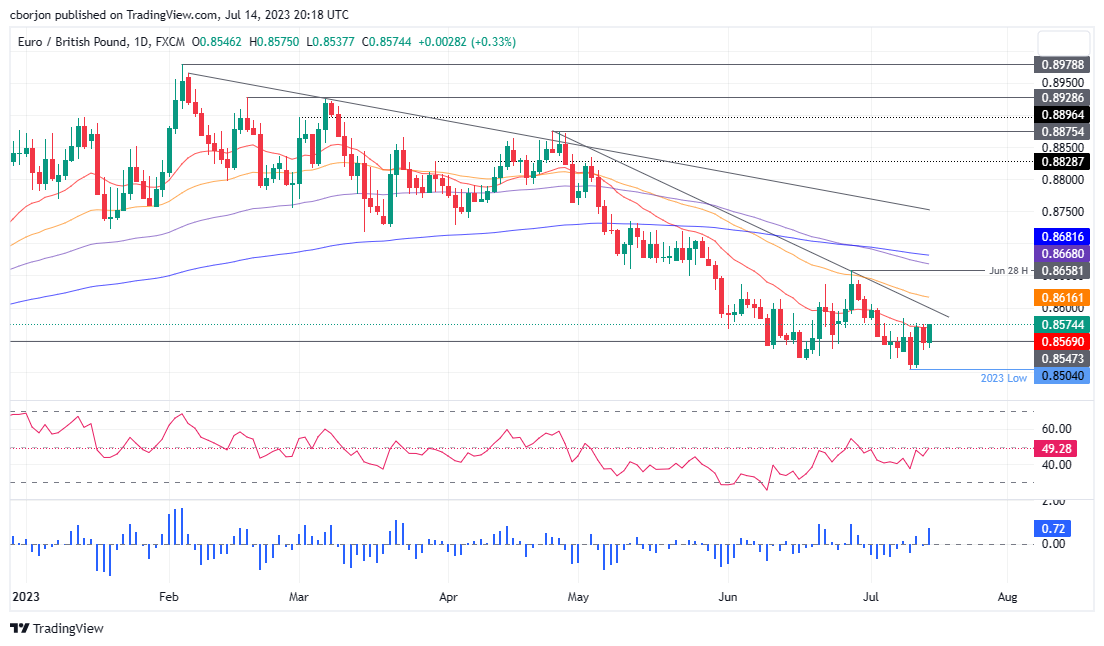
EUR/GBP reverses Thursday’s losses and is set to print weekly gains of 0.40% after Pound Sterling (GBP) bulls emerged yesterday, trimming some of its Wednesday losses. Nevertheless, selling pressure waned, and the EUR/GBP sits above a technical support level. At the time of writing, the EUR/GBP exchanges hands at 0.8573, up 0.32%.

EUR/GBP Price Analysis: Technical outlook

The EUR/GBP daily chart portrays the pair in consolidation, with a downward bias, which could extend if sellers drag prices past the year-to-date (YTD) low of 0.8504. In that event, the next support would be the 0.8450 psychological level before the EUR/GBP dives towards the August 24 swing low of 0.8408.

Conversely, the EUR/GBP could threaten to turn bullish, above the 50-day Exponential Moving Average (EMA) at 0.8616, which would be tested once the Eur/GBP passes the 0.8600 mark. A breach of the latter will expose the June 28 swing high at 0.8658, ahead of the 100-day EMA a 0.8668, followed by the 200-day EMA at 0.8681.

Oscillator-wise, the Relative Strength Index (RSI) is at the brisk of turning bullish, which could exacerbate the EUR bulls’ reaction. The three-day Rate of Change (RoC) portrays the cross as having an upward biased.

Hence, the EUR/GBP could be ready for a bullish resumption in the near term.

EUR/GBP Price Action

EUR/GBP Daily chart

EUR/GBP

Overview
Today last price0.8575
Today Daily Change0.0029
Today Daily Change %0.34
Today daily open0.8546
 
Trends
Daily SMA200.8569
Daily SMA500.8617
Daily SMA1000.8715
Daily SMA2000.8733
 
Levels
Previous Daily High0.8575
Previous Daily Low0.8535
Previous Weekly High0.8606
Previous Weekly Low0.8521
Previous Monthly High0.8658
Previous Monthly Low0.8518
Daily Fibonacci 38.2%0.855
Daily Fibonacci 61.8%0.856
Daily Pivot Point S10.8529
Daily Pivot Point S20.8512
Daily Pivot Point S30.849
Daily Pivot Point R10.8569
Daily Pivot Point R20.8592
Daily Pivot Point R30.8609

Author

Christian Borjon Valencia

Markets analyst, news editor, and trading instructor with over 14 years of experience across FX, commodities, US equity indices, and global macro markets.

More from Christian Borjon Valencia
Share:

Editor's Picks

EUR/USD looks to regain the 200-day SMA

EUR/USD regains some balance and trade just above 1.1600 the figure ahead of the opening bell in Asia. The pair initially dipped to the 1.1530 zone for the first time since November, always following the stronger US Dollar and the marked flight-to-safety in the context of the ongoing Middle East crisis
 

GBP/USD slips below key averages as geopolitical risks mount

GBP/USD fell about 0.35% on Tuesday, settling around 1.3350 after slipping below the 200-day Exponential Moving Average for the first time since early December. The pair has pulled back sharply from its late-January high near 1.3870, shedding over 500 pips in a series of lower highs and lower lows. 

Gold falls to near $5,100 as inflation fears weigh amidst Middle East conflict

Gold price faces some selling pressure near $5,100 during the early Asian session on Wednesday. The precious metal falls amid a renewed US Dollar demand and dimming prospects for US rate cuts. The US ISM Services Purchasing Managers Index report will be published later on Wednesday. 

Ethereum: Whales step up buying as short positions contract

After holding firm heading into the last weekend, Ethereum whales have returned to action, pouncing on the volatility stemming from escalating military actions between the US and Iran.

Energy shock 2.0: Why rising Gas prices could hit the Euro

Even without a confirmed, sustained disruption, the mere risk to a key global energy chokepoint is enough to inject a significant premium into European Gas markets. And for the Euro, that matters.

Ripple falters amid sell-off jitters and negative funding rates

Ripple (XRP) has come under pressure, drifting lower to $1.35 at the time of writing on Tuesday. The over 2% correction looks poised to erase the previous day’s gains, which lifted the remittance token to $1.42.