|

EUR/CHF Price Forecast: Triangle pattern completing, breakout to follow

  • EUR/CHF has formed a Triangle pattern which looks poised to breakout
  • A downside break is marginally more probable given the longer-term trend is bearish. 

EUR/CHF has formed a Triangle pattern over the last three months which looks like it is on the verge of completing as it tapers to a tip at around 0.9400. A breakout should soon follow. 

EUR/CHF Daily Chart

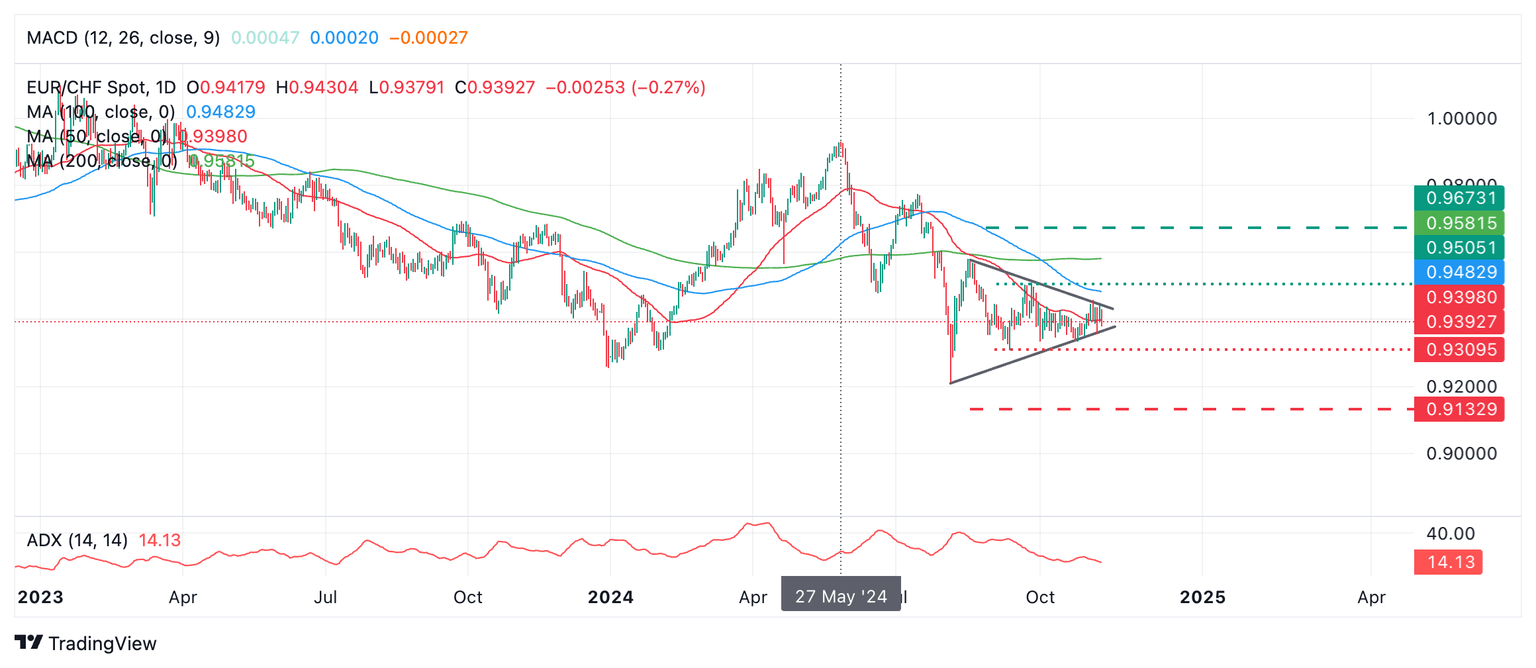
Since the market activity prior to the formation of the Triangle (Since May 27) was bearish and the longer-term trend is probably also down, the odds slightly favor a downside breakout. 

If EUR/CHF pierces below the lower boundary line of the Triangle and falls below the 0.9307 level (September 11 lows) it will probably confirm an authentic breakout. The next target to the downside would lie at 0.9132, the 61.8% Fibonacci extrapolation of the height of the Triangle lower. 

An upside breakout – though less likely – is possible. A move above the 0.9508 high of September 25 would probably confirm a bullish breakout and extend to the 0.9581 Fibonacci 61.8% target for the Triangle higher. 

The Average Directional Index (ADX) measures how strong the price is trending. At 14.13 it is currently relatively low, suggesting it will soon start rising again as price begins its next directional phase of development.  

Author

Joaquin Monfort

Joaquin Monfort is a financial writer and analyst with over 10 years experience writing about financial markets and alt data. He holds a degree in Anthropology from London University and a Diploma in Technical analysis.

More from Joaquin Monfort
Share:

Editor's Picks

EUR/USD tests nine-day EMA support near 1.1850

EUR/USD remains in the negative territory for the fourth successive session, trading around 1.1870 during the Asian hours on Friday. The 14-day Relative Strength Index momentum indicator at 56 stays above the midline, confirming steady momentum. RSI has eased but remains above 50, indicating momentum remains constructive for the bulls.

GBP/USD consolidates around 1.3600 vs. USD; looks to US CPI for fresh impetus

The GBP/USD pair remains on the defensive through the Asian session on Friday, though it lacks bearish conviction and holds above the 1.3600 mark as traders await the release of the US consumer inflation figures before placing directional bets.

Gold recovers swiftly from weekly low, climbs back closer to $5,000 ahead of US CPI

Gold regains positive traction during the Asian session on Friday and recovers a part of the previous day's heavy losses to the $4,878-4,877 region, or the weekly low. The commodity has now moved back closer to the $5,000 psychological mark as traders keenly await the release of the US consumer inflation figures for more cues about the Federal Reserve's policy path.

Solana: Mixed market sentiment caps recovery

Solana is trading at $79 as of Friday, following a correction of over 9% so far this week. On-chain and derivatives data indicates mixed sentiment among traders, further limiting the chances of a price recovery.

A tale of two labour markets: Headline strength masks underlying weakness

Undoubtedly, yesterday’s delayed US January jobs report delivered a strong headline – one that surpassed most estimates. However, optimism quickly faded amid sobering benchmark revisions.

Solana Price Forecast: Mixed market sentiment caps recovery

Solana (SOL) is trading at $79 as of Friday, following a correction of over 9% so far this week. On-chain and derivatives data indicates mixed sentiment among traders, further limiting the chances of a price recovery.