|

EUR/CHF Price Analysis: Refreshes seven-year low to hit parity, focus on 0.9725

  • EUR/CHF holds onto the bearish bias around multi-year low after posting the biggest weekly loss since January 2015.
  • Sustained break of five-year-old trend line, bearish MACD keeps sellers hopeful.
  • Oversold RSI challenges further downside, 50-SMA adds to the upside filters.

Having begun the week’s trading with a downside gap to 0.9985, EUR/CHF remains on the back foot around the lowest levels since early 2015 during Monday’s Asian session.

The cross-currency pair printed the biggest weekly losses since January 2015 at the latest before hitting the parity during the week-start trading.

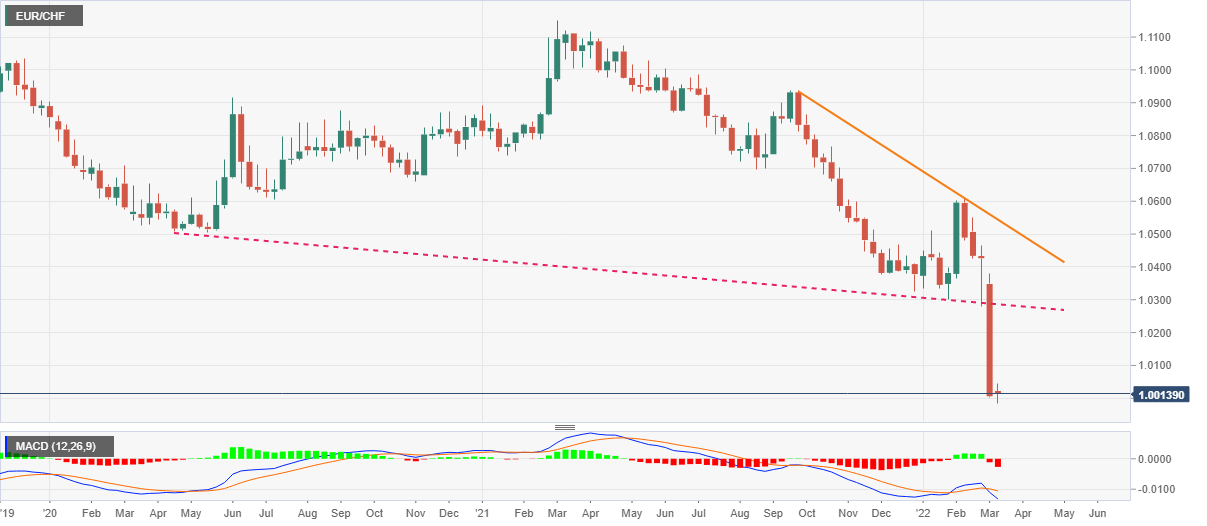
That said, the quote’s downside could be attributed to the broad risk-off mood and a clear break of previously key support lines from April 2020 and early 2017, respectively around 1.0420 and 1.0285 by the press time.

Also favoring the sellers are the bearish MACD conditions and an ongoing war between Russia and Ukraine.

As a result, EUR/CHF has a further downside towards testing the year 2015 bottom surrounding 0.9725. However, the oversold RSI may challenge the bear afterward.

EUR/CHF: Monthly chart

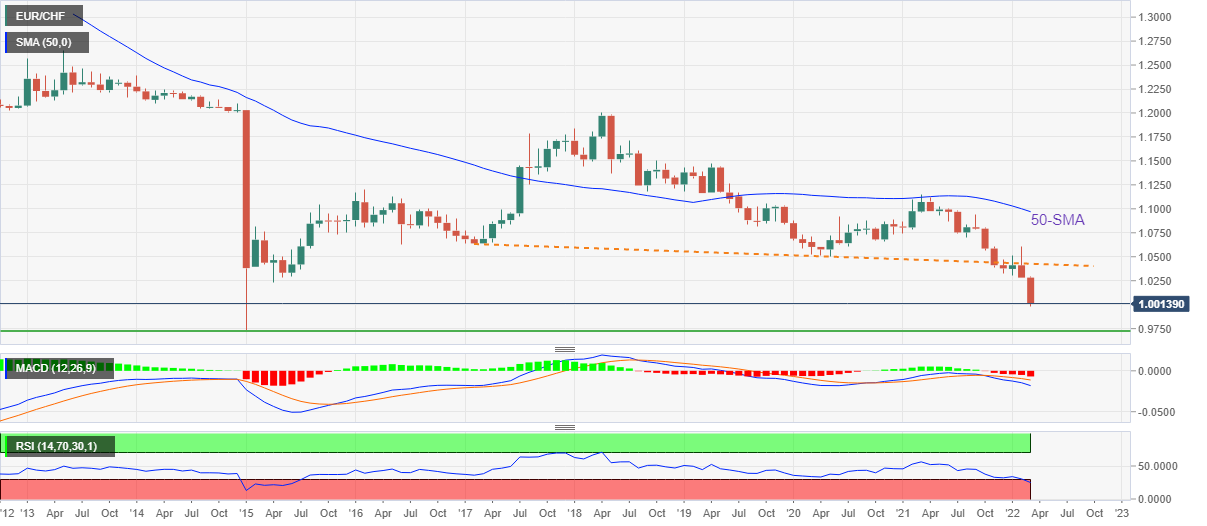
On the contrary, recovery moves beyond the 1.0420 support-turned-resistance level, will need validation from a six-month-old descending trend line on the weekly chart to challenge 50-SMA on the monthly formation, around 1.0550 and 1.0970 in that order.

EUR/CHF: Weekly chart

Additional important levels 

Overview
Today last price1.0006
Today Daily Change-0.0020
Today Daily Change %-0.20%
Today daily open1.0026
 
Trends
Daily SMA201.0401
Daily SMA501.0405
Daily SMA1001.0458
Daily SMA2001.0649
 
Levels
Previous Daily High1.0167
Previous Daily Low1.0018
Previous Weekly High1.0381
Previous Weekly Low1.0018
Previous Monthly High1.0612
Previous Monthly Low1.0279
Daily Fibonacci 38.2%1.0075
Daily Fibonacci 61.8%1.011
Daily Pivot Point S10.9974
Daily Pivot Point S20.9922
Daily Pivot Point S30.9825
Daily Pivot Point R11.0122
Daily Pivot Point R21.0219
Daily Pivot Point R31.0271

Author

Anil Panchal

Anil Panchal

FXStreet

Anil Panchal has nearly 15 years of experience in tracking financial markets. With a keen interest in macroeconomics, Anil aptly tracks global news/updates and stays well-informed about the global financial moves and their implications.

More from Anil Panchal
Share:

Editor's Picks

EUR/USD appears supported by the 200-day SMA, for now

Following an early pullback to multi-week lows near 1.1670, EUR/USD now manages to reclaim the 1.1700 region as the NA session draws to a close on Monday. The steep retracement in spot follows the equally strong move higher in the US Dollar, as investors continue to assess the geopolitical landscape in the wake of the US and Israel attacks on Iran.


GBP/USD hits new yearly lows near 1.3300

GBP/USD adds to the recent bearish tone, approaching to the key 1.3300 support to reach fresh YTD troughs against the backdrop of the robust performance of the US Dollar. Indeed, Cable’s decline comes amid the firm demand for the safe-haven space in the wake of the US and Israel attacks to Iran.

Gold eases some ground, approaches $5,300

Gold now surrenders part of the earlier advance, reshifting its attenton to the $5,300 zone per troy ounce at the beginning of the week. Indeed, the yellow metal’s firm performance appears propped up by incresing geopolitical jitters in the Middle East, which at the same time fuels the demand for the safe-haven space.

Strategy lifts holdings to 3.4% of Bitcoin's total supply amid inflows into crypto products

Strategy continued its accumulation of the top crypto last week, acquiring 3,015 BTC for $204 million amid renewed interest in crypto products after four weeks of outflows.

The Fed is finally talking about AI – Here's why it matters for the US Dollar

AI is moving from earnings calls into the heart of monetary policy discussions, forcing Federal Reserve officials to confront a new question: How to act if AI reshapes inflation, employment and interest rates at the same time?

Grass 20% bullish breakout defies broader market weakness

Grass (GRASS) is edging up above $0.30 at the time of writing on Monday. The token’s notable 20% intraday surge stands out amid heightened volatility in the broader crypto market.