EUR/CHF Price Analysis: Reaches new high for 2024
- EUR/CHF makes new year-to-date highs in 0.9630s.
- Short and intermediate trends are bullish – long-term still bearish.
- MACD is diverging bearishly, however, and triangles are bad omens.
EUR/CHF is trading higher at the start of the new week, exchanging hands in the 0.9630s, after achieving new year-to-date (YTD) highs. The pair is in an uptrend both on the short and intermediate time frame as the peaks and troughs continue rising. Given the old adage that “the trend is your friend” the progression higher is tipped to continue.
The EUR/CHF pair has broken out of the Symmetrical Triangle price pattern it formed last week and is close to reaching the minimum price objective for the breakout at 0.9648 – the 0.618 Fibonnaci ratio of the height of the triangle extrapolated from the breakout point higher.
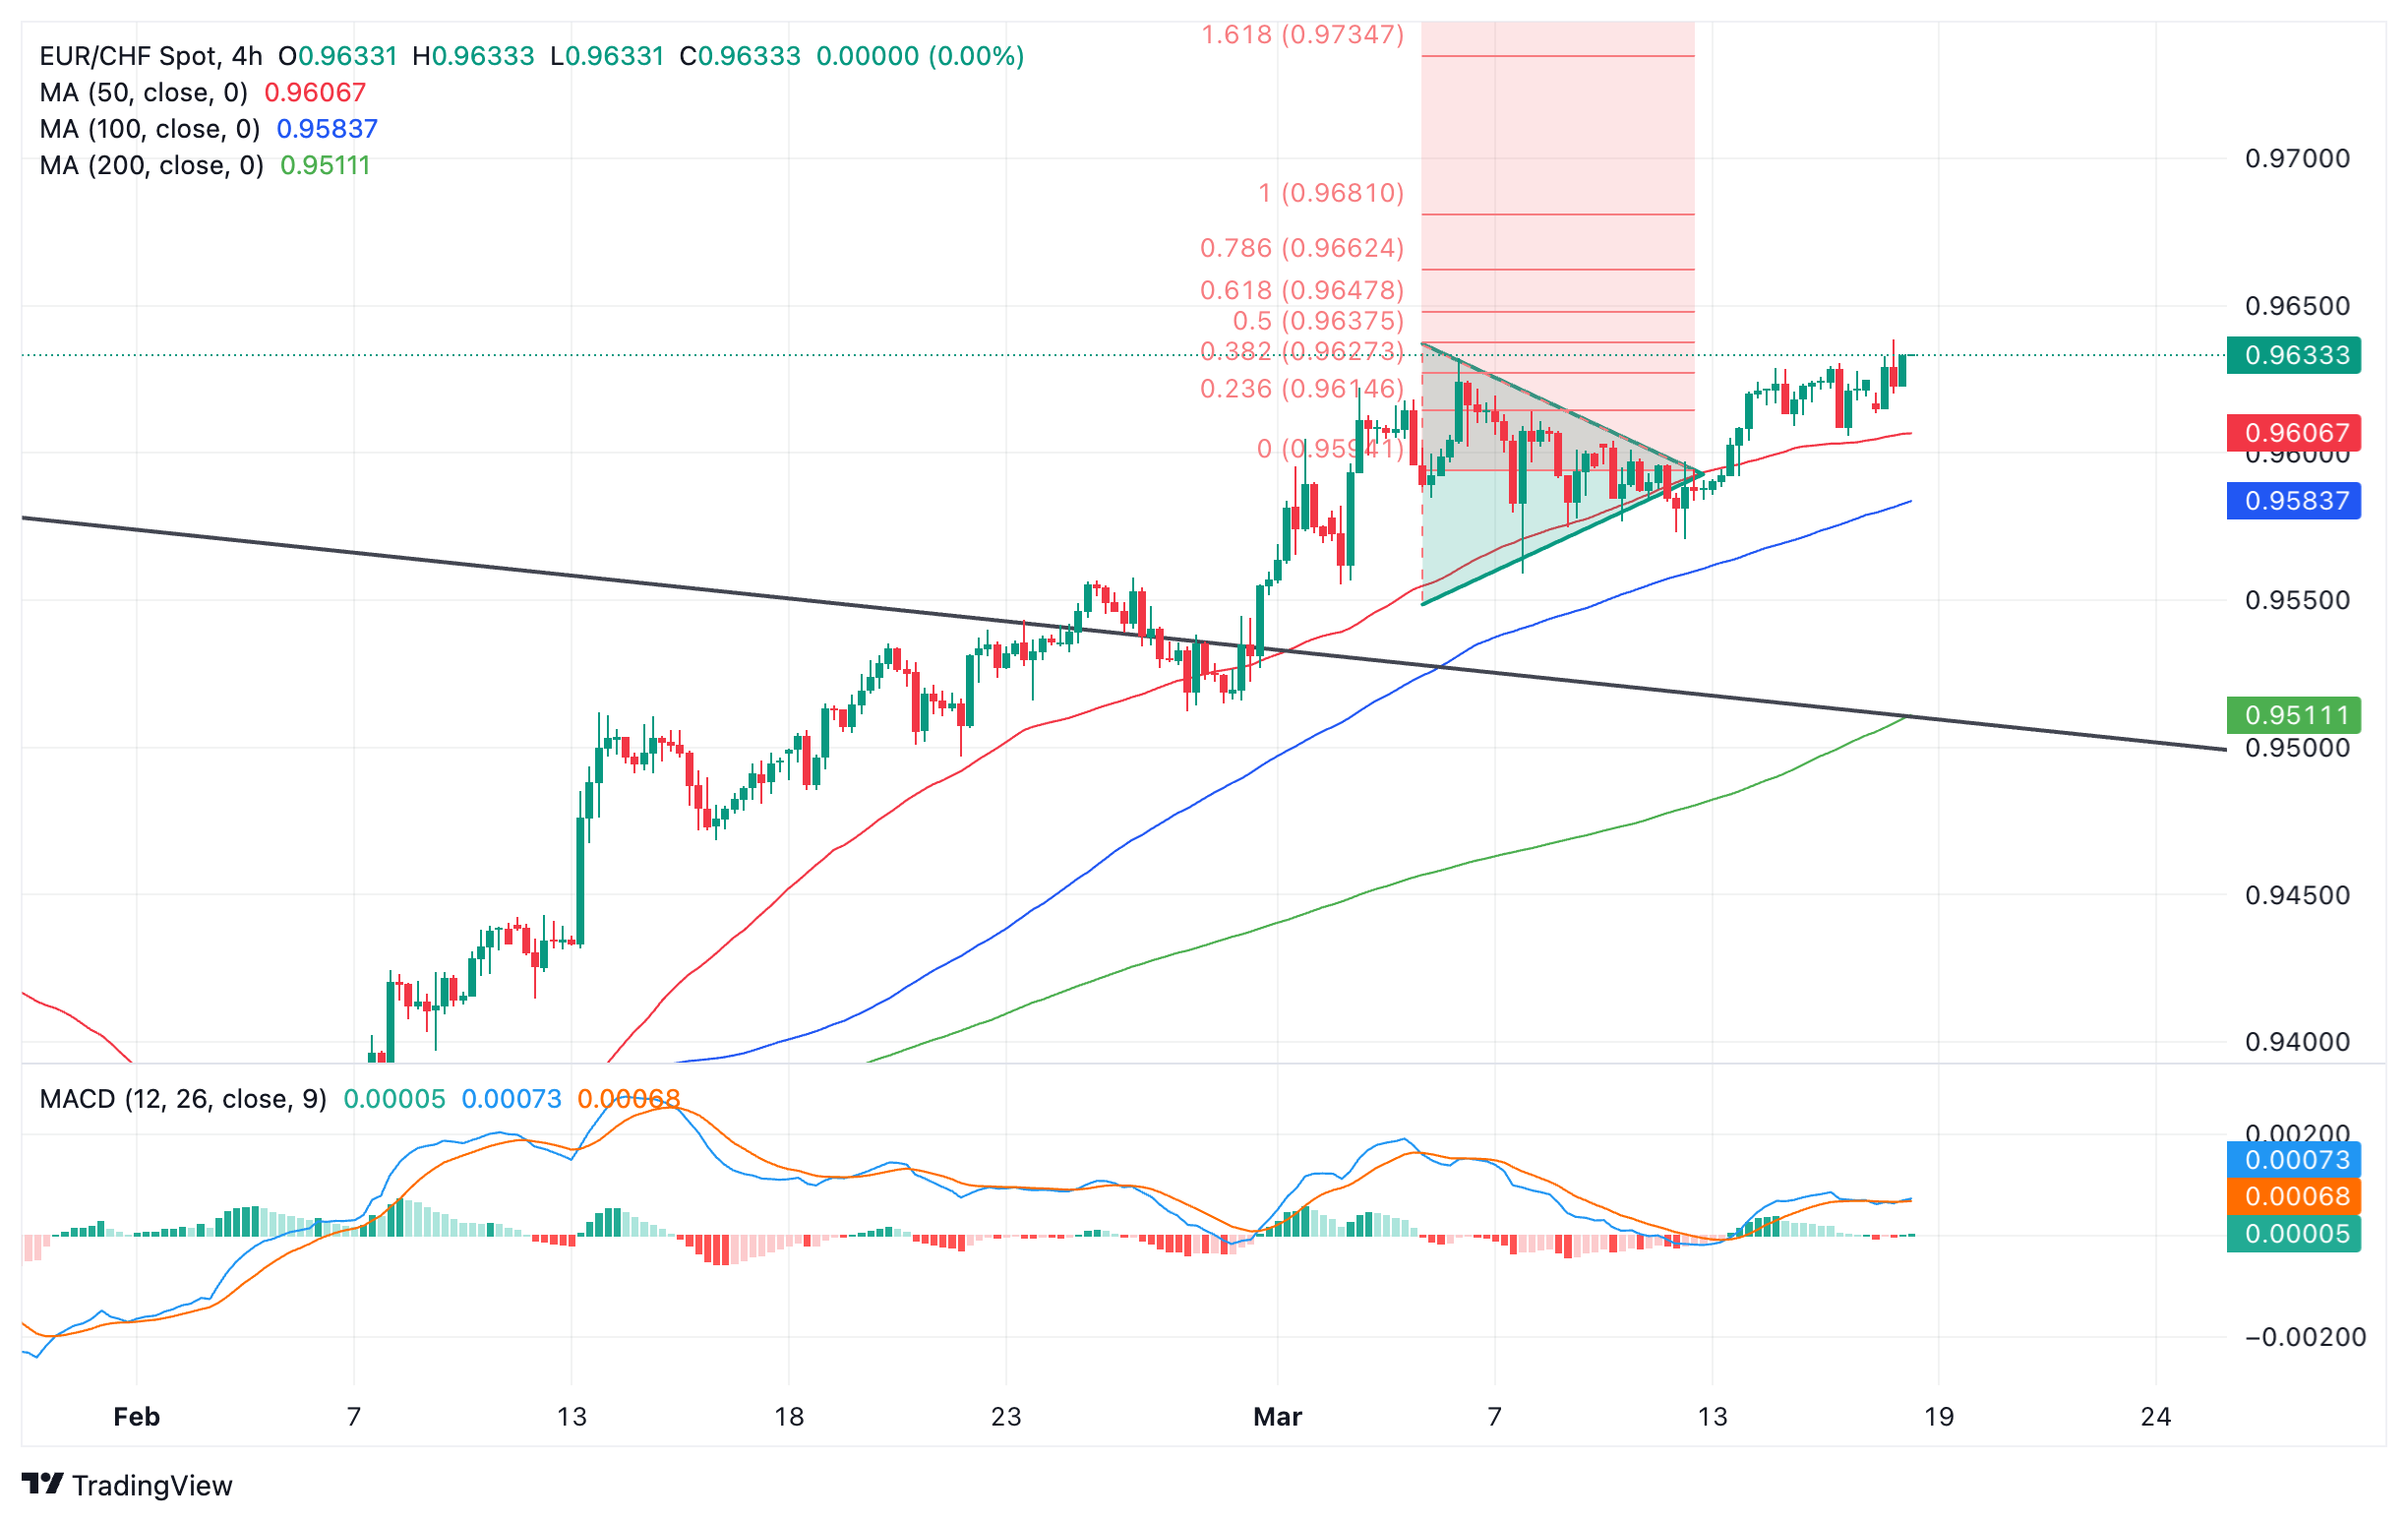
Euro to Swiss Franc: 4-hour chart
It is possible the price could also rise up to the 100% extension of the height of the triangle at 0.9680. Once met, however, there is a risk the pair could correct more substantially or even reverse as often triangles mark the penultimate moves in trends.
The Moving Average Convergence/ Divergence (MACD) momentum indicator is showing bearish divergence with price on the 4-hour chart. Whilst price reached a higher high (for the year) on Monday at 0.9638, the MACD failed to make a corresponding higher high. This suggests underlying weakness and the possibility the price may pullback, although so far there has been no reaction.
The MACD on the daily chart crossed below its signal line last week giving a sell signal, although price continued rising.
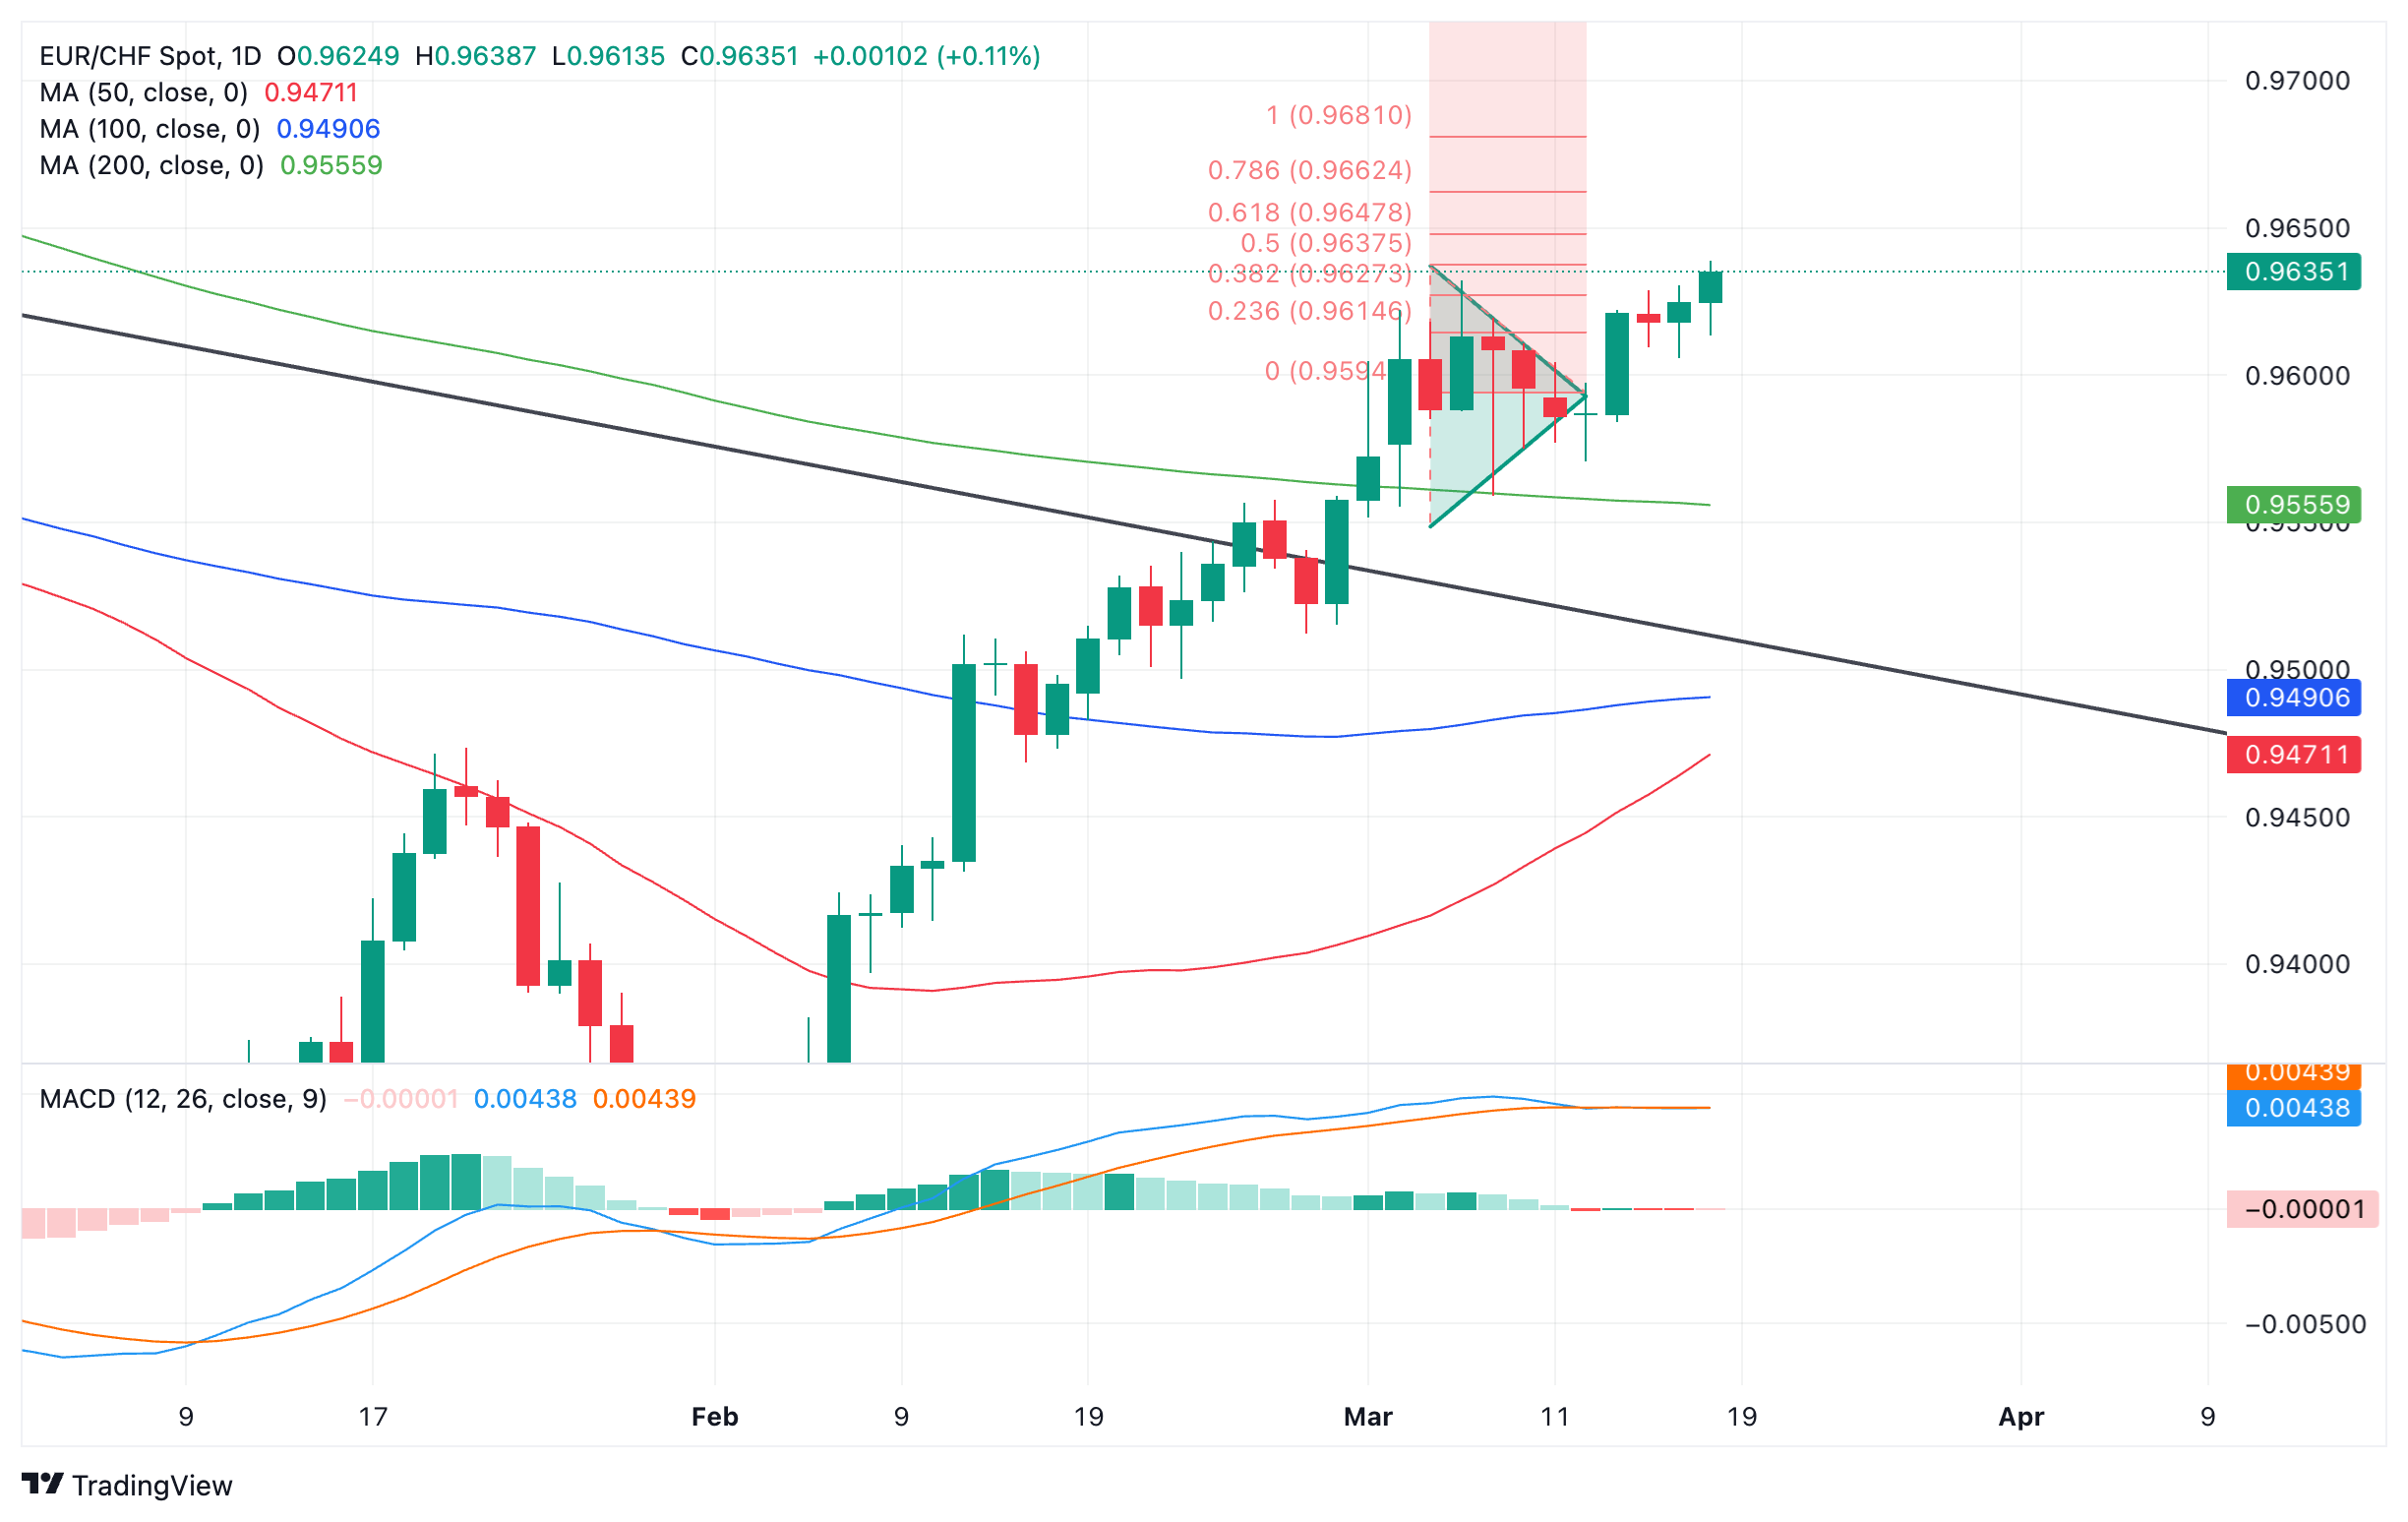
Euro to Swiss Franc: Daily chart
The pair has provisionally broken above the 50-week Simple Moving Average (SMA) at 0.9600. The SMA has acted as a dynamic resistance level repelling price repeatedly during its bear trend since 2021. Overall EUR/CHf remains in a long-term bear trend and would need to break above the 0.9685 November 2023 high to suggest reversal.
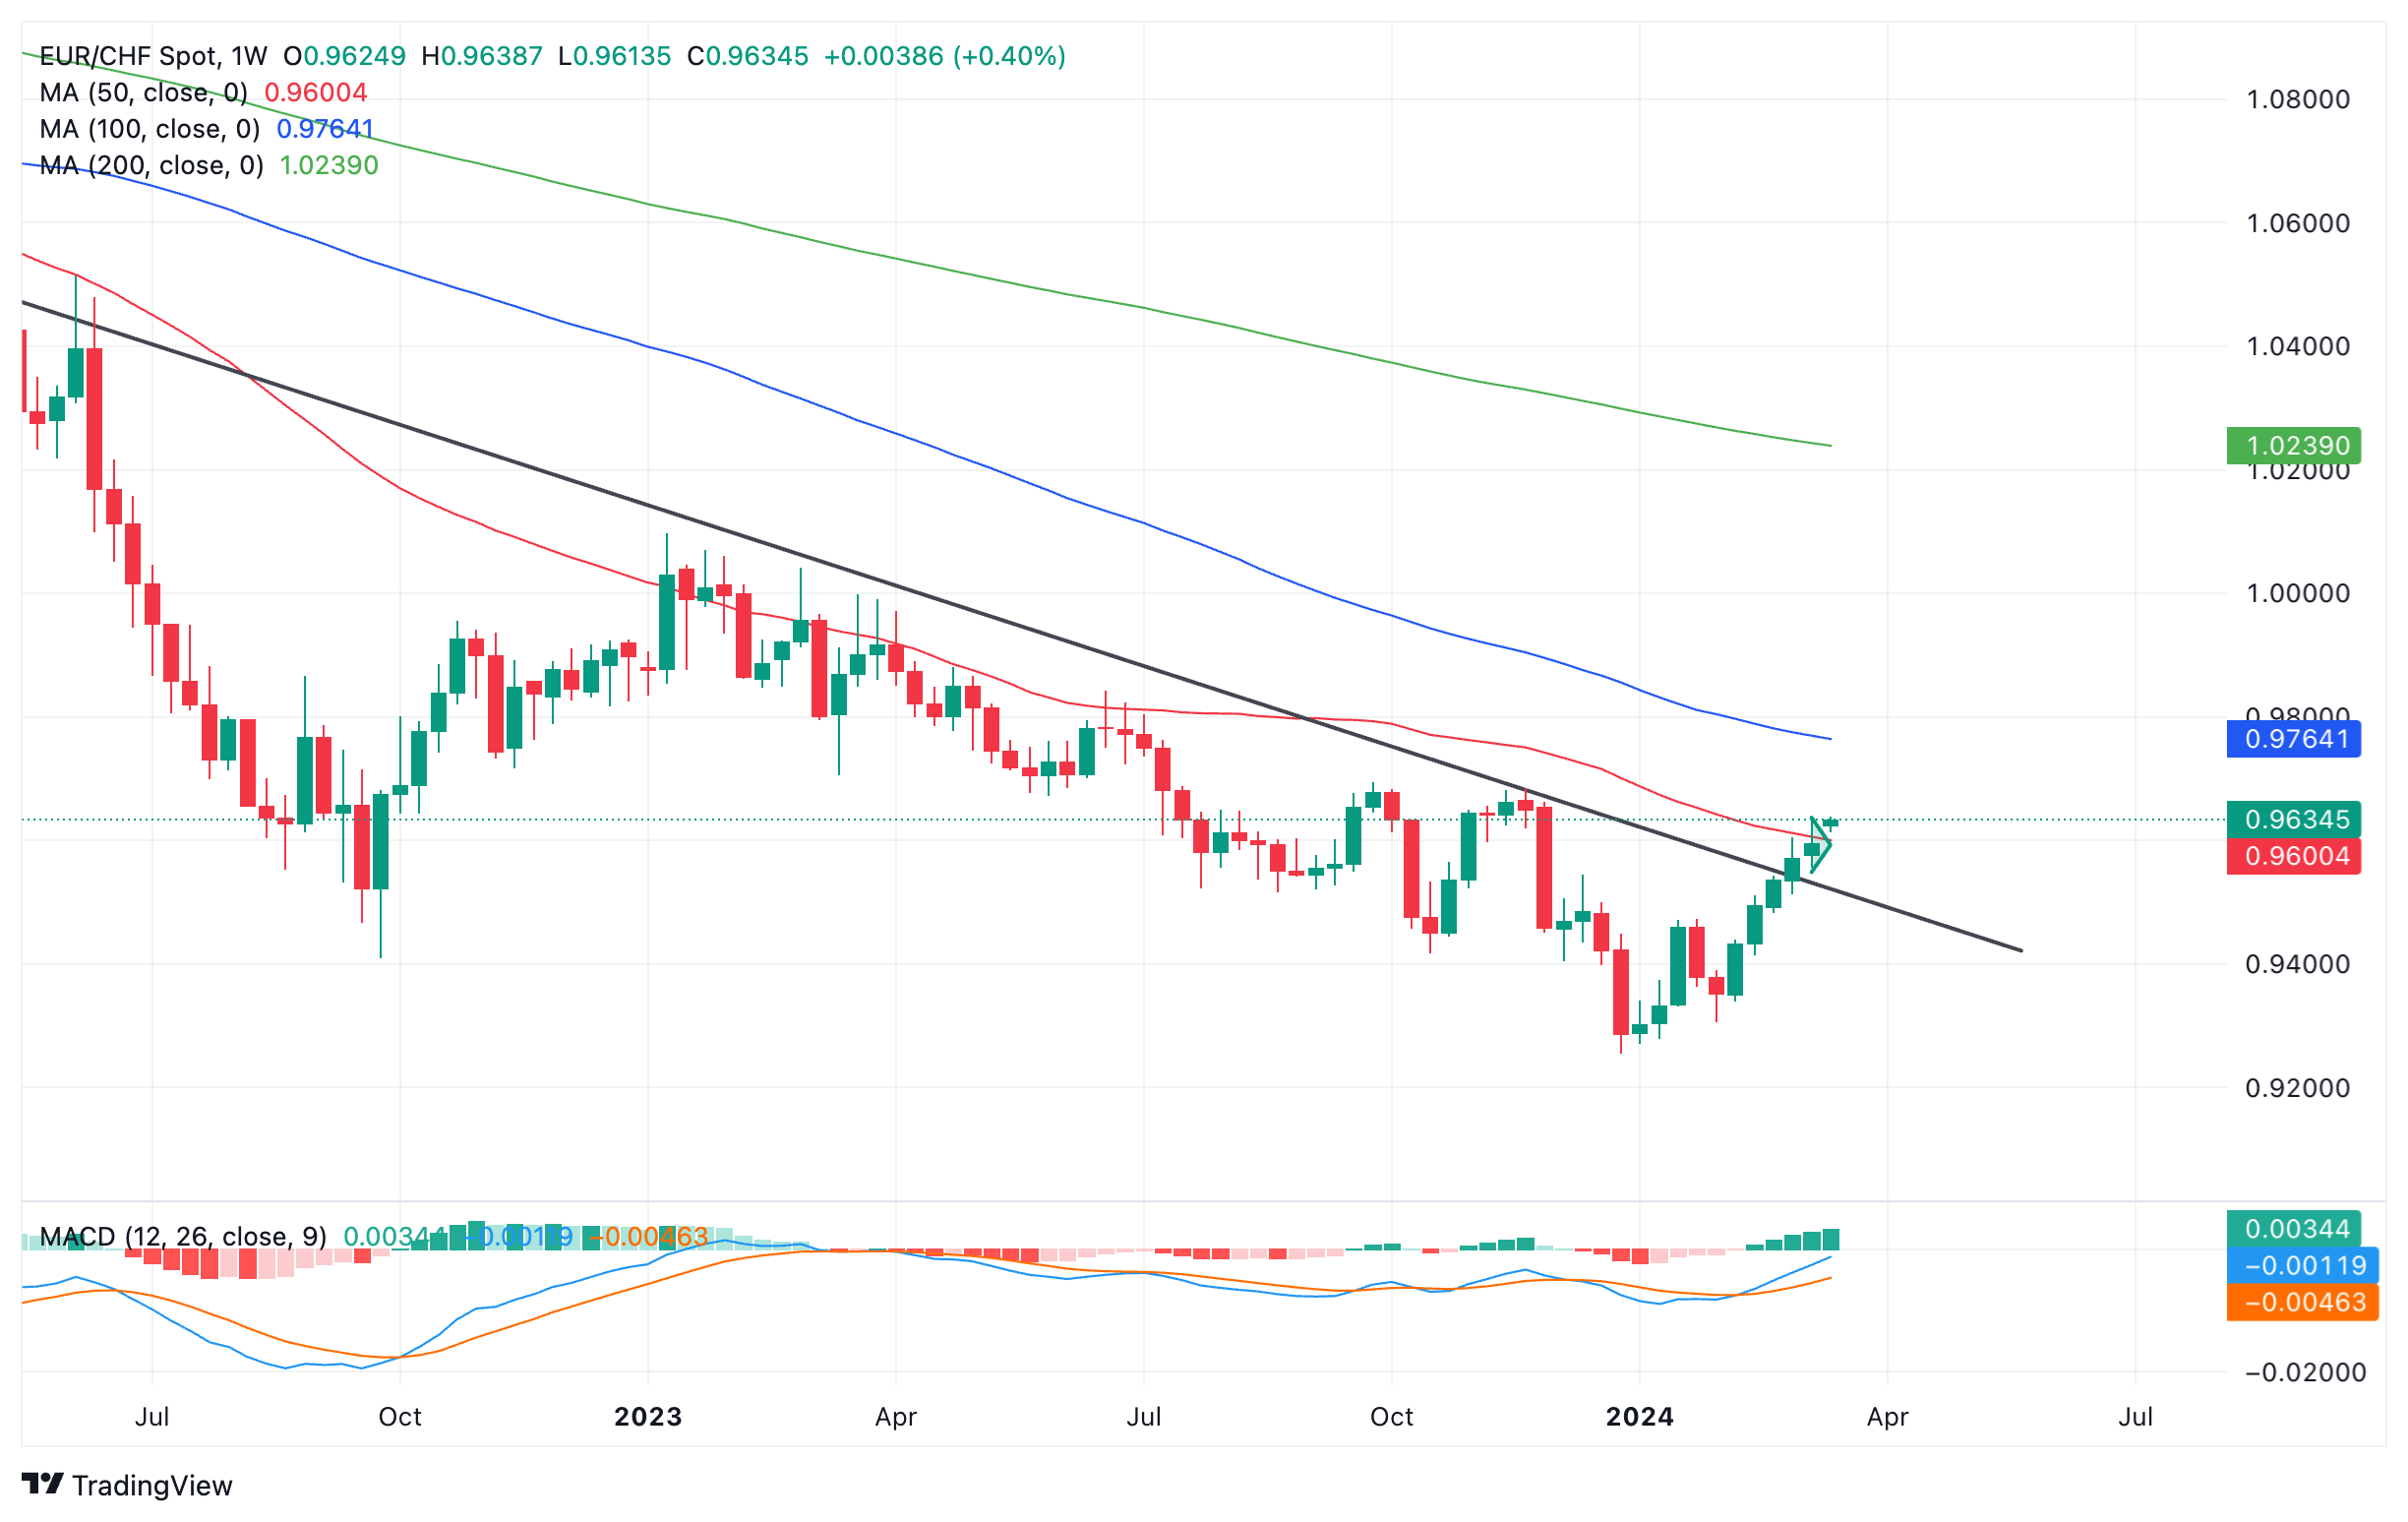
Euro to Swiss Franc: Weekly chart
Multiple touches indicates it is a significant barrier. If the break holds for another week that would strengthen the bullish case and suggest a major obstacle was in the rear view mirror. Currently it is too early to say whether this is the case.
Overall EUR/CHF remains in a long-term bear trend and would need to break above the 0.9685 November 2023 high to suggest reversal.
Author

Joaquin Monfort
FXStreet
Joaquin Monfort is a financial writer and analyst with over 10 years experience writing about financial markets and alt data. He holds a degree in Anthropology from London University and a Diploma in Technical analysis.


