|

EUR/CAD Price Forecast: Two possible scenarios for EUR/CAD

  • EUR/CAD could go higher after breaking out of a large multi-month consolidation. 
  • Alternatively, the pair might have formed a Double Top pattern and be about to fall.

EUR/CAD has two possible polar-opposite scenarios in which price could play out:

1) The pair is going higher – it has broken out from a consolidation pattern formed since August and is about to rally as it fulfills the price target for the pattern. 

2) The breakout above the upper trendline of the pattern is “false” and the pair has formed a small Double Top bearish reversal pattern (DT) instead. This will likely see prices fall if price breaks below the pattern’s lows.

EUR/CAD 4-hour Chart 

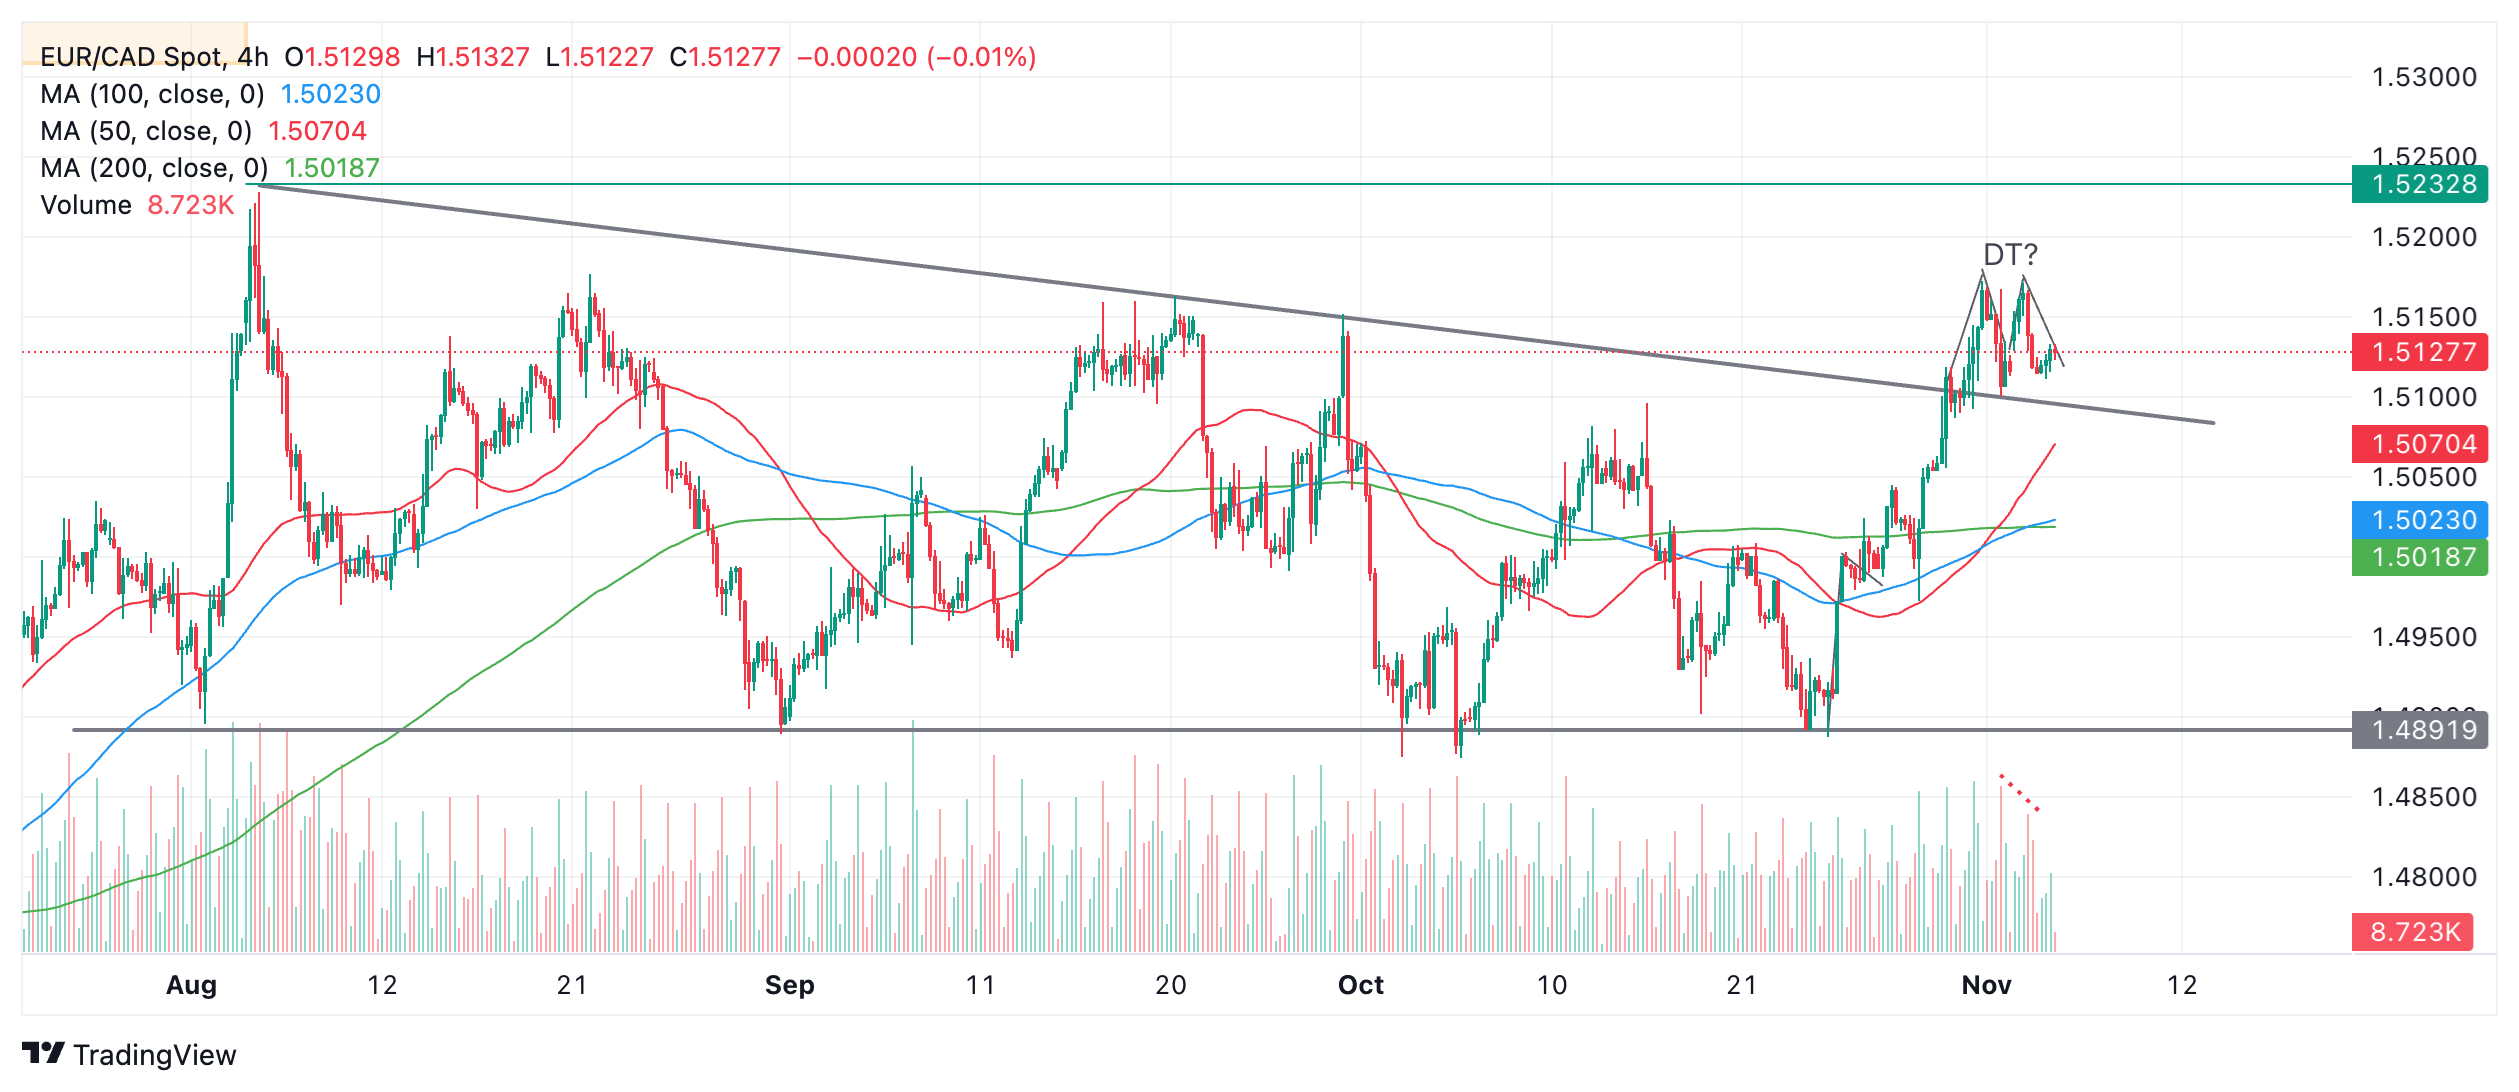
A break above the 1.5172 (November 1 high) would probably confirm scenario 1) and lead to a continuation higher, to an initial target at 1.5228, the August 5 high, followed by 1.5312, the 61.8% Fibonacci price projection of the height of the pattern. 

A break below 1.5101 (November 1 low), on the other hand, would probably confirm the DT and lead to a move down to 1.5051 which is equal to the height of the pattern extrapolated lower. 

Volume was lower on the right hand shoulder of the DT compared to the left (red dotted line on chart) which helps confirm the pattern as authentic and adds bearish color. 

Author

Joaquin Monfort

Joaquin Monfort is a financial writer and analyst with over 10 years experience writing about financial markets and alt data. He holds a degree in Anthropology from London University and a Diploma in Technical analysis.

More from Joaquin Monfort
Share:

Editor's Picks

EUR/USD flirts with weekly lows near 1.1770

EUR/USD now comes under further selling pressure, breaking below the 1.1800 support to challenge the area of weekly throughs near 1.1770 on Thursday. The pair’s decline comes in response to marked gains in the US Dollar amid steady geopolitical tensions. Ealier in the day, the ECB’s Lagarde delivered cautious remarks, although the currency remained apathetic.

GBP/USD threatens the 200-day SMA near 1.3440

GBP/USD rapidly leaves behind Wednesday’s strong advance, coming under heavy pressure and retesting the 1.3440 zone, where the critical 200-day SMA is located. Cable’s deep pullback follows the strong gains in the Greenback, while investors continue to pencil in a potential BoE rate cut in March.

Gold trims gains, slips back to around $5,170

Gold is now facing some downside pressure, hovering around the $5,170 region on Thursday. The yellow metal surrenders part of its earlier gains on the back of the resurgence of the buying interest in the Greenback. In the meantime, geopolitical tensions in the Middle East continue to limit the downside potential for now.

Stellar: Relief bounce fades as bearish undertone persists

Stellar is trading around $0.16 at the time of writing on Thursday after rebounding more than 8% in the previous day. Derivatives data paints a negative picture as XLM’s short bets hit a monthly high while Open Interest continues to decline.

Changing the game: International implications of recent tariff developments

The Supreme Court ruling on International Emergency Economic Powers Act (IEEPA) tariffs provides limited relief for the rest of the world, with weighted average tariff rates modestly lower.

Bitcoin steadies as traders eye US–Iran talks

Bitcoin (BTC) price is stabilizing around $68,000 at the time of writing on Thursday after a 6.2% relief rally the previous day amid a broader downward trend.