|

Elliott Wave view on DAX looking for larger degree correction [Video]

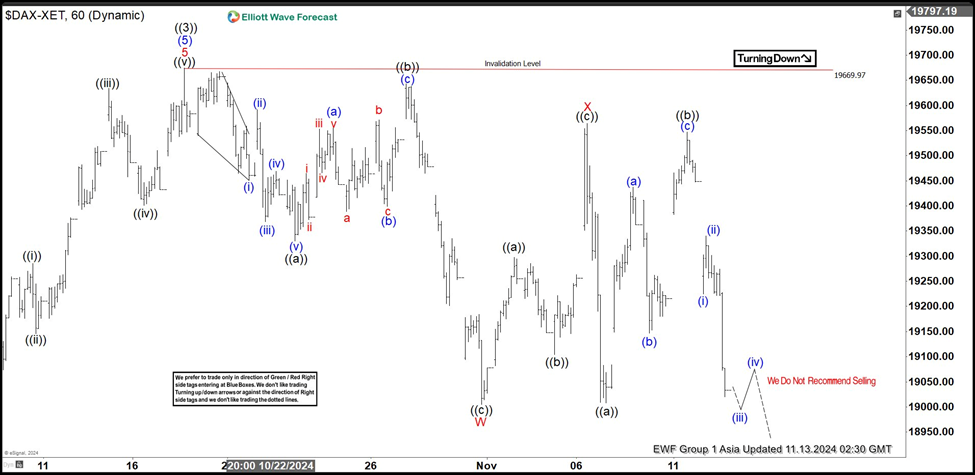
Short Term Elliott Wave View in DAX suggests rally to 19670 ended wave ((3)). Wave ((4)) pullback is currently in progress as a double three Elliott Wave structure.  Down from wave ((3)), wave (i) ended at 19451.7 and rally in wave (ii) ended at 19591.5. Wave (iii) lower ended at 19368.69 and wave (iv) rally ended at 19468.6. Final wave (v) lower ended at 19330.1 which completed wave ((a)). Rally in wave ((b)) ended at 19643.12 with internal subdivision as a zigzag. Up from wave ((a)), wave (a) ended at 19555.45 and wave (b) ended at 19399.16. Wave (c) higher ended at 19643.12 which completed wave ((b)) in higher degree.

Wave ((c)) lower ended at 19004.97 which completed wave W in higher degree. Up from wave W, wave ((a)) rally ended at 19297.6 and wave ((b)) ended at 19104.59. Wave ((c)) higher ended at 19563.97 which completed wave X in higher degree. Index has turned lower in wave Y with internal subdivision as a zigzag structure. Down from wave X, wave ((a)) ended at 19007.88. Wave ((b)) rally ended at 19456.9 and Index has turned lower. Near term, as far as pivot at 19669.9 high stays intact, expect Index to extend lower.

DAX 60 minutes Elliott Wave chart

DAX

DAX Elliott Wave [Video]

Author

Elliott Wave Forecast Team

Elliott Wave Forecast Team

ElliottWave-Forecast.com

More from Elliott Wave Forecast Team
Share:

Editor's Picks

EUR/USD tests nine-day EMA support near 1.1850

EUR/USD inches lower during the Asian hours on Monday, trading around 1.1870 at the time of writing. The 14-day Relative Strength Index momentum indicator at 56 stays above the midline, confirming improving momentum. RSI has cooled from prior overbought readings but stabilizes above 50, suggesting dips could stay limited before buyers reassert control.

GBP/USD flat lines as traders await key UK macro data and FOMC minutes

The GBP/USD pair kicks off a new week on a subdued note and oscillates in a narrow range, just below mid-1.3600s, during the Asian session. Moreover, the mixed fundamental backdrop warrants some caution for aggressive traders as the market focus now shifts to this week's important releases from the UK and the US.

Gold slides below $5,000 amid USD uptick and positive risk tone; downside seems limited

Gold attracts fresh sellers at the start of a new week and reverses a part of Friday's strong move up of over $150 from sub-$4,900 levels. The commodity slides back below the $5,000 psychological mark during the Asian session, though the downside potential seems limited amid a combination of supporting factors.

Bitcoin, Ethereum and Ripple consolidate within key ranges as selling pressure eases

Bitcoin and Ethereum prices have been trading sideways within key ranges following the massive correction. Meanwhile, XRP recovers slightly, breaking above the key resistance zone. The top three cryptocurrencies hint at a potential short-term recovery, with momentum indicators showing fading bearish signs.

Global inflation watch: Signs of cooling services inflation

Realized inflation landed close to expectations in January, as negative base effects weighed on the annual rates. Remaining sticky inflation is largely explained by services, while tariff-driven goods inflation remains limited even in the US.

Ripple Price Forecast: XRP potential bottom could be in sight

Ripple edges up above the intraday low of $1.35 at the time of writing on Friday amid mixed price actions across the crypto market. The remittance token failed to hold support at $1.40 the previous day, reflecting risk-off sentiment amid a decline in retail and institutional sentiment.