|premium|

Elliott Wave view: IBEX has resumed downside [Video]

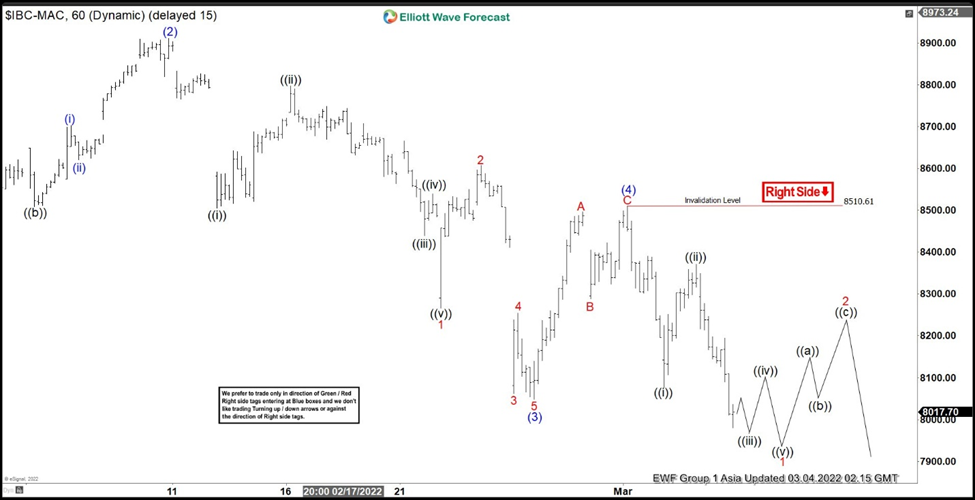
Short Term Elliott Wave View in IBEX suggests the decline from November 1, 2021 peak is unfolding as a 5 waves diagonal. Down from November 1, 2021 peak, wave (1) ended at 8082.4 and rally in wave (2) ended at 8912.20. The Index resumes lower in wave (3) which ended at 8048. The 1 hour chart below shows that move in wave (3) which subdivides in another 5 waves in smaller degree. Down from wave (2), wave 1 ended at 8266.9 and wave 2 ended at 8607.10. Wave 3 ended at 8061.2, wave 4 rally ended at 8254.10, and wave 5 lower ended at 8048.30 which completed wave (3).

Bounce in wave (4) ended at 8509.90 with internal subdivision as a zigzag. Up from wave (3), wave A ended at 8496.4, wave B ended at 8288.8, and wave C ended at 8510.61. Index has extended lower in wave (5). Down from wave (4), wave ((i)) ended at 8076.40 and rally in wave ((ii)) ended at 8370.80. Near term as far as pivot at 8510.61 stays intact, expect rally to fail in the sequence of 3, 7, or 11 swing for further downside. n of wave w which comes at 3629 – 3998.

IBEX 1 hour Elliott Wave chart

Chart

IBEX Elliott Wave video

Premium

You have reached your limit of 3 free articles for this month.

Start your subscription and get access to all our original articles.

Subscribe to PremiumSign In

Author

Elliott Wave Forecast Team

Elliott Wave Forecast Team

ElliottWave-Forecast.com

More from Elliott Wave Forecast Team
Share:

Editor's Picks

EUR/USD consolidates around 1.0900, bullish bias remains ahead of key US data

The EUR/USD pair is seen consolidating its strong gains registered over the past two days and oscillating in a narrow band during the Asian session on Tuesday. Spot prices currently trade around the 1.1900 mark, just below an over one-week high touched the previous day.

GBP/USD tilts bullish as markets barrel toward mid-week NFP print

GBP/USD is holding a broader bullish structure on the daily chart, with price trading well above the 50 Exponential Moving Average at 1.3507 and the 200 EMA at 1.3310, confirming the intermediate uptrend that has been in place since the November 2025 low near 1.2300. 

Gold: Will US Retail Sales data propel it above $5,100?

Gold hovers below weekly highs of $5,087 early Tuesday, await US Retail Sales data. The US Dollar enters a downside consolidation phase amid persistent Japanese Yen strength and worsening labor market. Gold settled Monday above $5,000, now looks to take out $5,100 amid bullish daily RSI.

Top Crypto Gainers: World Liberty Financial, MemeCore and Quant gain momentum

World Liberty Financial, MemeCore, and Quant are leading gains over the last 24 hours as the broader cryptocurrency market stabilizes after last week’s correction. Still, the technical outlook for altcoins remains mixed due to prevailing downside pressure and vulnerable market sentiment. 

Follow the money, what USD/JPY in Tokyo is really telling you

Over the past two Tokyo sessions, this has not been a rate story. Not even close. Interest rate differentials have been spectators, not drivers. What has moved USD/JPY in local hours has been flow and flow alone.

Ripple exposed to volatility amid low retail interest, modest fund inflows

Ripple (XRP) is extending its intraday decline to around $1.40 at the time of writing on Monday amid growing pressure from the retail market and risk-off sentiment that continues to keep investors on the sidelines.