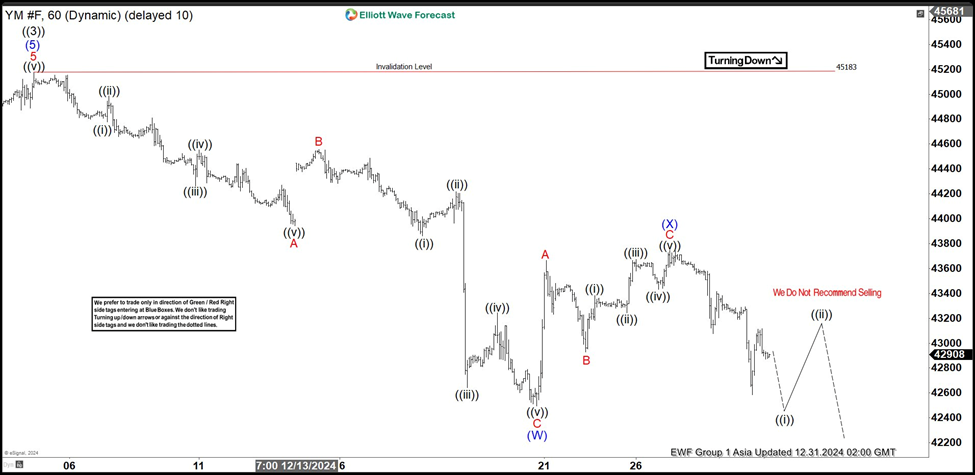
Short Term Elliott Wave view of Dow Futures (YM) is looking for a larger degree correction against cycle from 3.15.2023 low in 3, 7, or 11 swing. Rally to 45183 ended cycle from 3.15.2023 low as wave ((3)) per 1 hour chart below. Wave ((4)) pullback is now in progress to correct that cycle. Internal subdivision of wave ((4)) is unfolding as a double three Elliott Wave structure. Down from wave ((3)), wave A ended at 43941 and wave B rally ended at 44556. Wave C lower ended at 42496 which completed wave (W) in higher degree.
Rally in wave (X) unfolded as a zigzag Elliott Wave structure. Up from wave (W), wave A ended at 43663 and wave B ended at 42928. Wave C higher ended at 43746 which completed wave (X). The Index has turned lower in wave (Y), but it still needs to break below wave (W) at 42496 to validate this view. Near term, as far as pivot at 45183 high stays intact, expect the Index to extend lower. Potential target for wave (Y) lower is 100% – 161.8% Fibonacci extension of wave (W). This area comes at 39403 – 41060 area where buyers can appear for more upside or 3 waves rally at least.
Dow Futures (YM) 60 minutes Elliott Wave chart
Dow Futures (YM) Elliott Wave [Video]
FURTHER DISCLOSURES AND DISCLAIMER CONCERNING RISK, RESPONSIBILITY AND LIABILITY Trading in the Foreign Exchange market is a challenging opportunity where above average returns are available for educated and experienced investors who are willing to take above average risk. However, before deciding to participate in Foreign Exchange (FX) trading, you should carefully consider your investment objectives, level of xperience and risk appetite. Do not invest or trade capital you cannot afford to lose. EME PROCESSING AND CONSULTING, LLC, THEIR REPRESENTATIVES, AND ANYONE WORKING FOR OR WITHIN WWW.ELLIOTTWAVE- FORECAST.COM is not responsible for any loss from any form of distributed advice, signal, analysis, or content. Again, we fully DISCLOSE to the Subscriber base that the Service as a whole, the individual Parties, Representatives, or owners shall not be liable to any and all Subscribers for any losses or damages as a result of any action taken by the Subscriber from any trade idea or signal posted on the website(s) distributed through any form of social-media, email, the website, and/or any other electronic, written, verbal, or future form of communication . All analysis, trading signals, trading recommendations, all charts, communicated interpretations of the wave counts, and all content from any media form produced by www.Elliottwave-forecast.com and/or the Representatives are solely the opinions and best efforts of the respective author(s). In general Forex instruments are highly leveraged, and traders can lose some or all of their initial margin funds. All content provided by www.Elliottwave-forecast.com is expressed in good faith and is intended to help Subscribers succeed in the marketplace, but it is never guaranteed. There is no “holy grail” to trading or forecasting the market and we are wrong sometimes like everyone else. Please understand and accept the risk involved when making any trading and/or investment decision. UNDERSTAND that all the content we provide is protected through copyright of EME PROCESSING AND CONSULTING, LLC. It is illegal to disseminate in any form of communication any part or all of our proprietary information without specific authorization. UNDERSTAND that you also agree to not allow persons that are not PAID SUBSCRIBERS to view any of the content not released publicly. IF YOU ARE FOUND TO BE IN VIOLATION OF THESE RESTRICTIONS you or your firm (as the Subscriber) will be charged fully with no discount for one year subscription to our Premium Plus Plan at $1,799.88 for EACH person or firm who received any of our content illegally through the respected intermediary’s (Subscriber in violation of terms) channel(s) of communication.
Recommended content
Editors’ Picks

AUD/USD: Bulls need to clear the 200-day SMA Premium
AUD/USD treaded water around 0.6360 after once again faltering near recent tops in the 0.6440 zone, always on the back of the intense recovery in the US Dollar. In the meantime, positive headlines on the US-China trade front could help the Aussie stay in the upper end of the range for the time being.

EUR/USD: Minor support lies around 1.1300 Premium
EUR/USD remained on the back footing as the Greenback intensified its recovery in response to alleviated concerns over the Fed’s independence and encouraging news surrounding the US-China trade conflict.

Gold corrected extreme conditions, struggles around $3,300
Gold extended its decline on Wednesday, slipping below the $3,300 mark per troy ounce in response to reports from the media suggesting the Trump administration is weighing tariff reductions on Chinese goods, a news that revived hopes of easing trade tensions and reduced demand for the yellow metal as a safe-haven asset.

Crypto Today: SUI, Solana and Cardano among best performers as BTC tops $94K
Bitcoin market updates:

Five fundamentals for the week: Traders confront the trade war, important surveys, key Fed speech Premium
Will the US strike a trade deal with Japan? That would be positive progress. However, recent developments are not that positive, and there's only one certainty: headlines will dominate markets. Fresh US economic data is also of interest.

The Best brokers to trade EUR/USD
SPONSORED Discover the top brokers for trading EUR/USD in 2025. Our list features brokers with competitive spreads, fast execution, and powerful platforms. Whether you're a beginner or an expert, find the right partner to navigate the dynamic Forex market.