|premium|

Elliott Wave view: Amazon (AMZN Stock) should continue impulsive rally [Video]

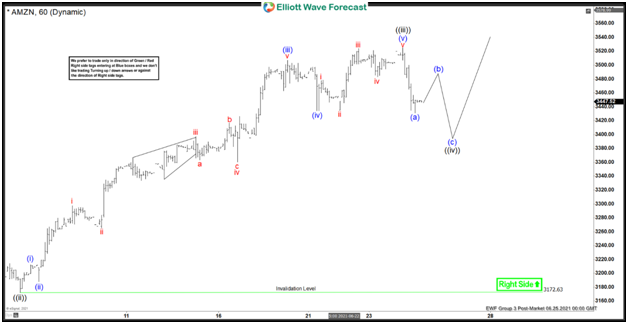
Short term Elliott Wave View in Amazon (AMZN) suggests the rally from May 11, 2021 low is unfolding as a 5 waves impulse Elliott Wave structure. Up from May 11 low, wave ((1)) ended at 3312 and pullback in wave ((ii)) ended at 3172.2. The stock then resumed higher in wave ((iii)) which ended at 3524.86. The internal of wave ((iii)) unfolded as another impulse in lesser degree as the 1 hour chart below shows.

Up from wave ((ii)), wave (i) ended at 3212.36 and pullback in wave (ii) ended at 3187.89. The stock resumed higher in wave (iii) towards 3507, wave (iv) pullback ended at 3434, and final leg wave (v) higher ended at 3524.86. This completed wave ((iii)) in higher degree. Wave ((iv)) pullback is now in progress to correct cycle from June 8 low before the rally resumes. Internal of wave ((iv)) is in progress as a zigzag structure where wave (a) ended at 3430.85. Expect the stock to bounce in wave (b), then turns lower 1 more time to end wave (c) of ((iv)) before the rally resumes. Potential target for wave ((iv)) is 23.6 – 38.2% Fibonacci retracement of wave ((iii)) which comes at 3389.4 – 3440.7. Near term, as far as June 8 pivot low at 3172.6 remains intact, expect dips to find support in 3, 7, or 11 swing for further upside.

Amazon (AMZN) 60 minutes Elliott Wave chart

AMZN

AMZN Elliott Wave video

Premium

You have reached your limit of 3 free articles for this month.

Start your subscription and get access to all our original articles.

Subscribe to PremiumSign In

Author

Elliott Wave Forecast Team

Elliott Wave Forecast Team

ElliottWave-Forecast.com

More from Elliott Wave Forecast Team
Share:

Editor's Picks

EUR/USD treads water above 1.1850 amid thin trading

EUR/USD stays defensive but holds 1.1850 amid quiet markets in the European hours on Monday.  The US Dollar is struggling for direction due to thin liquidity conditions as US markets are closed in observance of Presidents' Day. 

GBP/USD flat lines as traders await key UK and US macro data

GBP/USD kicks off a new week on a subdued note and oscillates in a narrow range near 1.365 in Monday's European trading. The mixed fundamental backdrop warrants some caution for aggressive traders as the market focus now shifts to this week's important releases from the UK and the US.

Gold sticks to intraday losses; lacks follow-through

Gold remains depressed through the early European session on Monday, though it has managed to rebound from the daily trough and currently trades around the $5,000 psychological mark. Moreover, a combination of supporting factors warrants some caution for aggressive bearish traders, and before positioning for deeper losses.

Bitcoin, Ethereum and Ripple consolidate within key ranges as selling pressure eases

Bitcoin and Ethereum prices have been trading sideways within key ranges following the massive correction. Meanwhile, XRP recovers slightly, breaking above the key resistance zone. The top three cryptocurrencies hint at a potential short-term recovery, with momentum indicators showing fading bearish signs.

Global inflation watch: Signs of cooling services inflation

Realized inflation landed close to expectations in January, as negative base effects weighed on the annual rates. Remaining sticky inflation is largely explained by services, while tariff-driven goods inflation remains limited even in the US.

Ripple Price Forecast: XRP potential bottom could be in sight

Ripple edges up above the intraday low of $1.35 at the time of writing on Friday amid mixed price actions across the crypto market. The remittance token failed to hold support at $1.40 the previous day, reflecting risk-off sentiment amid a decline in retail and institutional sentiment.