|

Elliott Wave perspective: Dow futures (YM) poised to continue its rally [Video]

The short-term Elliott Wave perspective for Dow Futures (YM) indicates that the wave IV pullback concluded at 40725, as illustrated in the 1-hour chart below. The Index has begun to climb in wave V. However, it must still surpass the prior peak of 45227, set on January 31, 2025, to eliminate the possibility of a double correction downward. The rally from the wave IV low has so far unfolded in three swings. For greater confidence in continued upward momentum, it’s advisable to wait until a five-swing pattern emerges.

Dow futures (YM) 60 minutes Elliott Wave chart

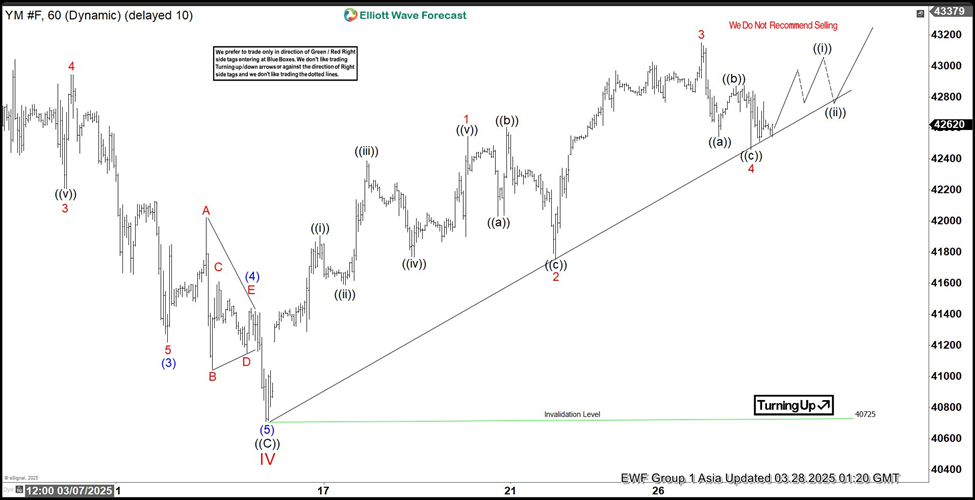
The rally from wave IV is expected to develop as a five-swing diagonal Elliott Wave structure. From the wave IV low, wave ((i)) peaked at 41905, followed by a wave ((ii)) pullback that bottomed at 41587. Wave ((iii)) then advanced to 42388, with the subsequent wave ((iv)) pullback concluding at 41769. The final leg, wave ((v)), reached 42544, marking the completion of wave 1 on a larger degree. The ensuing wave 2 correction then found its low at 41751. From that point, the wave 3 rally reached its peak at 43148, followed by a wave 4 pullback that bottomed at 42459. In the near term, as long as the pivotal low at 40725 holds, anticipate that any pullback will attract buyers within a 3, 7, or 11-swing pattern, paving the way for further upside.

YM_F [Video]

Author

Elliott Wave Forecast Team

Elliott Wave Forecast Team

ElliottWave-Forecast.com

More from Elliott Wave Forecast Team
Share:

Markets move fast. We move first.

Orange Juice Newsletter brings you expert driven insights - not headlines. Every day on your inbox.

By subscribing you agree to our Terms and conditions.

Editor's Picks

EUR/USD stays defensive below 1.1750 as USD finds its feet

EUR/USD kicks off the new week on a softer note, holding below 1.1750 in European trading on Monday. The pair faces challenges due to a pause in the US Dollar downtrend, with traders shifting their focus to the delayed US Nonfarm Payrolls and CPI data for fresh directives. The ECB policy decision is also eagerly awaited. 

GBP/USD holds steady above 1.3350 as traders await key data and BoE

GBP/USD remains on the back foot above 1.3350 in the European session on Monday, though it lacks bearish conviction and holds above the key 200-day SMA support. The US Dollar holds its recovery mode ahead of key data releases, while the Pound Sterling faces headwinds from the expected BoE rate cut this week. 

Gold climbs to seven-week highs on Fed rate cut bets, safe-haven demand

Gold price rises to seven-week highs to near $4,350 during the early European trading hours on Monday. The precious metal extends its upside amid the prospect of interest rate cuts by the US Fed next year. Lower interest rates could reduce the opportunity cost of holding Gold, supporting the non-yielding precious metal.

Solana consolidates as spot ETF inflows near $1 billion signal institutional dip-buying

Solana price hovers above $131 at the time of writing on Monday, nearing the upper boundary of a falling wedge pattern, awaiting a decisive breakout. On the institutional side, demand for spot Solana Exchange-Traded Funds remained firm, pushing total assets under management to nearly $1 billion since launch. 

Big week ends with big doubts

The S&P 500 continued to push higher yesterday as the US 2-year yield wavered around the 3.50% mark following a Federal Reserve (Fed) rate cut earlier this week that was ultimately perceived as not that hawkish after all. The cut is especially boosting the non-tech pockets of the market.

Solana Price Forecast: SOL consolidates as spot ETF inflows near $1 billion signal institutional dip-buying

Solana (SOL) price hovers above $131 at the time of writing on Monday, nearing the upper boundary of a falling wedge pattern, awaiting a decisive breakout.