|

Elliott Wave looking for alphabet (GOOGL) to extend impulsive rally [Video]

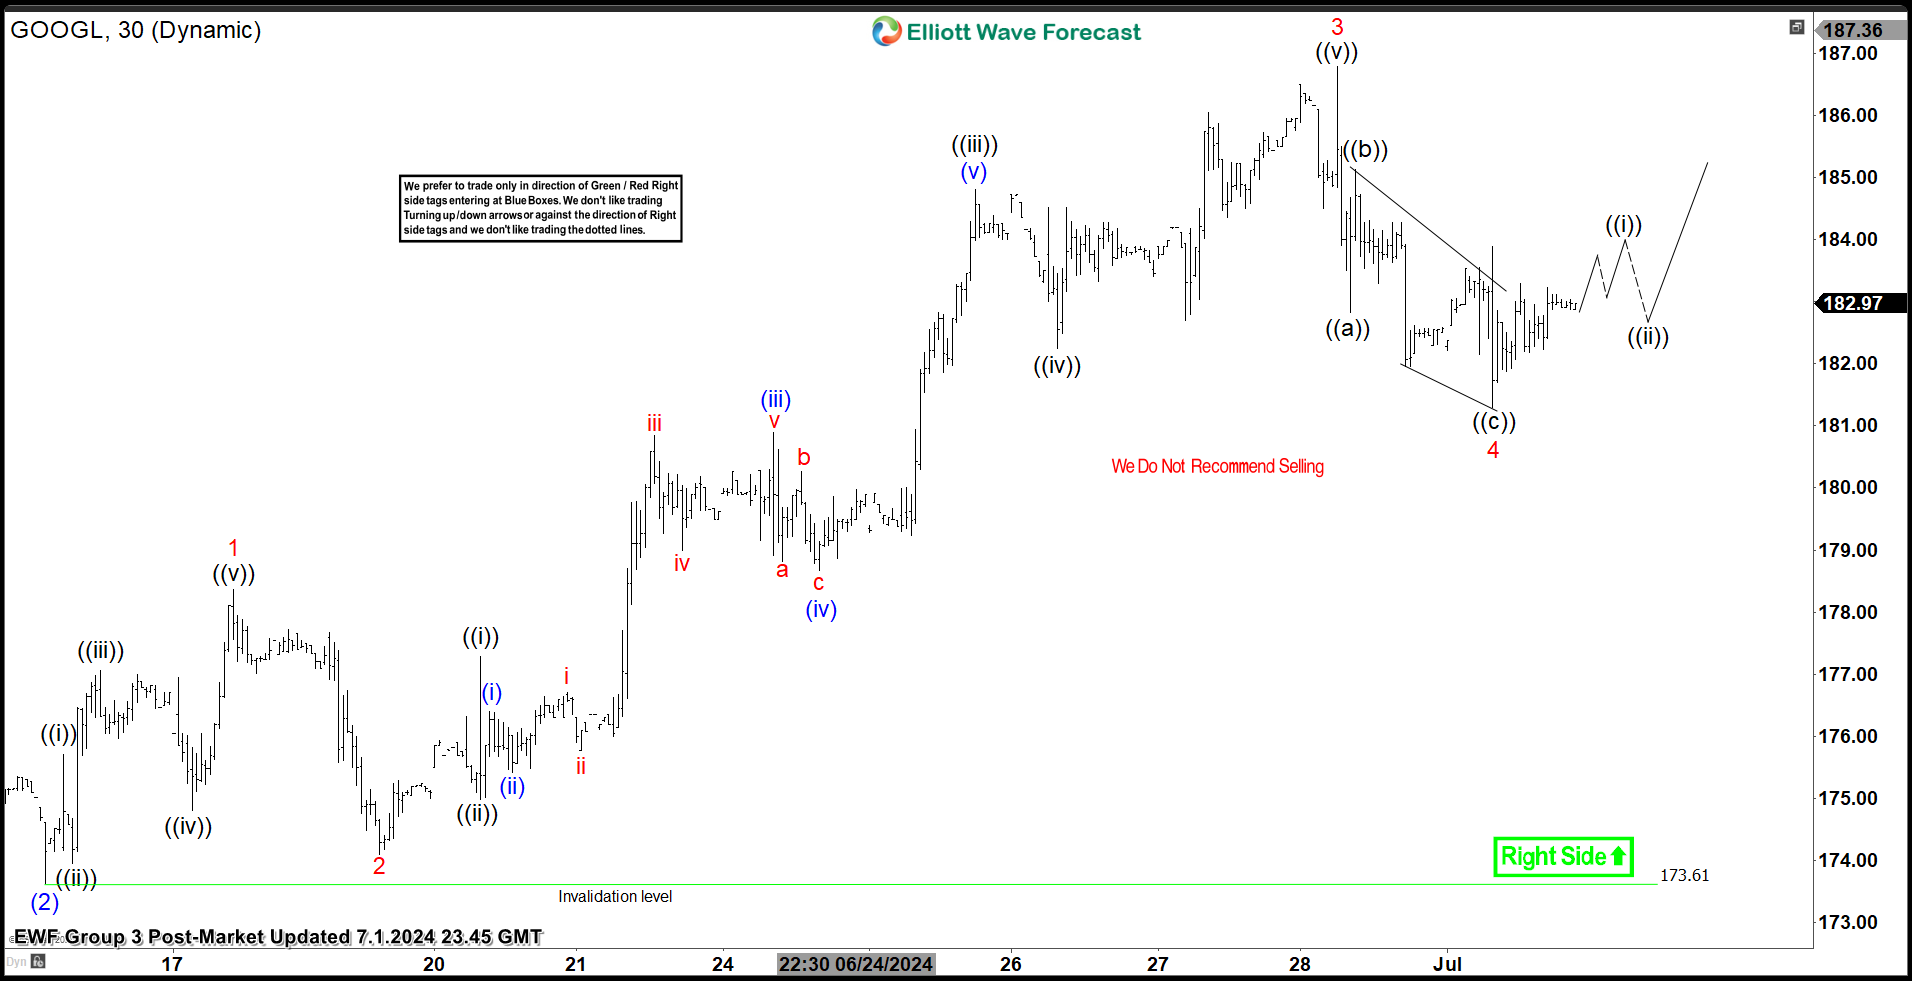
Short Term Elliott Wave in GOOGL suggests the bullish impulse sequence in progress & expect to remain supported in 3, 7 or 11 swings in pullback to resume rally within the sequence from October-2022 low. It favors upside in (3) of ((5)) in 4-hour sequence against 173.63 low from 6.14.2024 low & expect one more push higher in 5, while proposed ended 4 at 181.30 low. Within (3) sequence, it should break above 186.78 high to confirm the upside to be 5 to finish (3) of ((5)). In 4-hour, it ended (1) at 180.41 high & (2) at 173.63 low in the sequence started from 5.01.2024 low.

Up from (2) low, it placed 1 of (3) at 178.36 high & 2 pullback at 174.10 low as dip pullback. Above there, it ended 3 at 186.78 high as extended move & proposed ended 4 at 181.30 low as 3 swing correction. Within 3, it placed ((i)) at 177.29 high, ((ii)) at 174.99 low, ((iii)) at 184.80 high, ((iv)) at 182.25 low & finally ended ((v)) at 186.78 high as 3 of (3). Short term, as long as it stays above 181.30 low, it should resume higher in 5 towards 188.08 – 190.19 area, which confirms above 186.78 high. Alternatively, if it breaks below 181.30 low, it can do double correction in (4) and should correct against 6.14.2024 low before resume rally as (5) of ((5)). In either the case, as long as it stays above 6.14.2024 low, it should resume rally in bullish sequence.

GOOGL 30 minutes Elliott Wave chart

Chart

GOOGL Elliott Wave [Video]

Author

Elliott Wave Forecast Team

Elliott Wave Forecast Team

ElliottWave-Forecast.com

More from Elliott Wave Forecast Team
Share:

Editor's Picks

EUR/USD: Bears retain control below 1.1780-1.1770 confluence breakpoint

The EUR/USD pair remains on the back foot through the Asian session on Friday and currently trades just above mid-1.1700s, well within striking distance of a nearly one-month low set the previous day.

GBP/USD seems vulnerable near one-month low as traders await US data

The GBP/USD pair prolongs its weekly downtrend for the fifth consecutive day on Friday and slides back closer to a nearly one-month low, touched the previous day. Spot prices trade below mid-1.3400s during the Asian session on Friday and seem vulnerable to slide further as traders now look to important US macro data for a fresh impetus.

Gold eyes next breakout on US GDP, PCE inflation data

Gold sticks to recent gains around the $5,000-mark early Friday, biding time before the high-impact US macro events. The focus is now on the US fourth-quarter Gross Domestic Product, core Personal Consumption Expenditures Price Index and the Supreme Court’s ruling on President Donald Trump’s tariffs.

Bitcoin, Ethereum and Ripple remain range-bound as breakdown risks rise

Bitcoin, Ethereum, and Ripple are trading sideways within consolidation ranges on Friday, signaling a lack of directional bias in the broader crypto market. BTC rebounded from key support, and ETH is nearing the lower consolidation boundary, while XRP is holding at its lower trendline boundary. 

Hawkish Fed minutes and a market finding its footing

It was green across the board for US Stock market indexes at the close on Wednesday, with most S&P 500 names ending higher, adding 38 points (0.6%) to 6,881 overall. At the GICS sector level, energy led gains, followed by technology and consumer discretionary, while utilities and real estate posted the largest losses.

Official Trump price approaches breakout with mixed signals from traders

Official Trump (TRUMP) is trading at $3.50 at the time of writing, approaching its upper consolidation range. A breakout from this range could open the door for an upside move. On-chain data shows market indecision, with balanced flows between bulls and bears, signaling a lack of clear directional bias.