![]() Elliott Wave Forecast Team
Elliott Wave Forecast Team
ElliottWave-Forecast.com
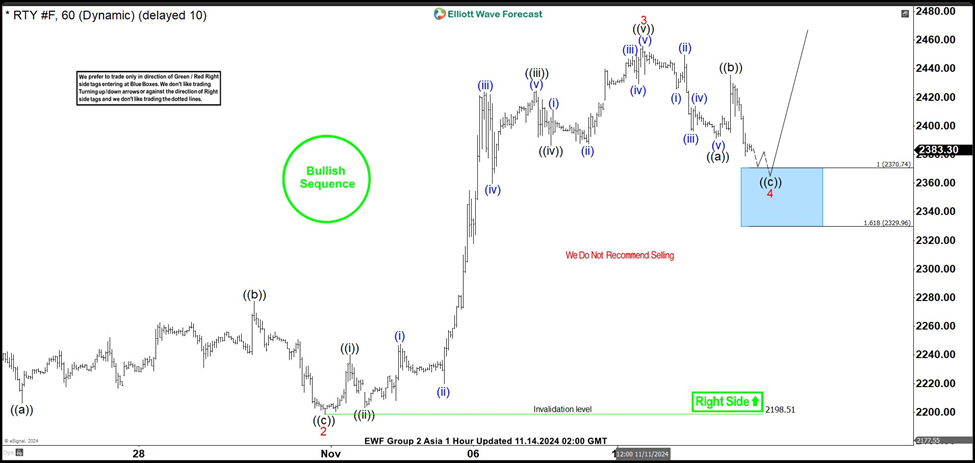
Short Term Elliott Wave view on Russell 2000 (RTY) suggests rally from 8.5.2024 low is in progress as a 5 waves impulse. Up from 8.5.2024 low, wave 1 ended at 2311.4 and pullback in wave 2 ended at 2198.51 like the 1 hour chart below shows. The Index then extends higher in wave 3 with internal subdivision as an impulse. Up from wave 2, wave ((i)) ended at 2240 and dips in wave ((ii)) ended at 2203.3. Rally in wave ((iii)) higher ended at 2424.5 and pullback in wave ((iv)) ended at 2386.5. Final leg wave ((v)) ended at 2455.6 which completed wave 3 in higher degree.
Wave 4 pullback is in progress with internal subdivision as a zigzag Elliott Wave structure. Down from wave 3, wave (i) ended at 2425.9 and wave (ii) rally ended at 2449.7. Wave (iii) lower ended at 2396.3 and wave (iv) rally ended at 2413.8. Final leg wave (v) ended at 2391.4 which completed wave ((a)) in higher degree. Rally in wave ((b)) ended at 2435.6. Expect wave ((c)) lower to end at 2330 – 2370 area to complete wave 4 in higher degree. From there, the Index can then see further upside or rally in 3 waves at least.
Russell 2000 (RTY) 60 minutes Elliott Wave chart
RTY_F Elliott Wave [Video]
FURTHER DISCLOSURES AND DISCLAIMER CONCERNING RISK, RESPONSIBILITY AND LIABILITY Trading in the Foreign Exchange market is a challenging opportunity where above average returns are available for educated and experienced investors who are willing to take above average risk. However, before deciding to participate in Foreign Exchange (FX) trading, you should carefully consider your investment objectives, level of xperience and risk appetite. Do not invest or trade capital you cannot afford to lose. EME PROCESSING AND CONSULTING, LLC, THEIR REPRESENTATIVES, AND ANYONE WORKING FOR OR WITHIN WWW.ELLIOTTWAVE- FORECAST.COM is not responsible for any loss from any form of distributed advice, signal, analysis, or content. Again, we fully DISCLOSE to the Subscriber base that the Service as a whole, the individual Parties, Representatives, or owners shall not be liable to any and all Subscribers for any losses or damages as a result of any action taken by the Subscriber from any trade idea or signal posted on the website(s) distributed through any form of social-media, email, the website, and/or any other electronic, written, verbal, or future form of communication . All analysis, trading signals, trading recommendations, all charts, communicated interpretations of the wave counts, and all content from any media form produced by www.Elliottwave-forecast.com and/or the Representatives are solely the opinions and best efforts of the respective author(s). In general Forex instruments are highly leveraged, and traders can lose some or all of their initial margin funds. All content provided by www.Elliottwave-forecast.com is expressed in good faith and is intended to help Subscribers succeed in the marketplace, but it is never guaranteed. There is no “holy grail” to trading or forecasting the market and we are wrong sometimes like everyone else. Please understand and accept the risk involved when making any trading and/or investment decision. UNDERSTAND that all the content we provide is protected through copyright of EME PROCESSING AND CONSULTING, LLC. It is illegal to disseminate in any form of communication any part or all of our proprietary information without specific authorization. UNDERSTAND that you also agree to not allow persons that are not PAID SUBSCRIBERS to view any of the content not released publicly. IF YOU ARE FOUND TO BE IN VIOLATION OF THESE RESTRICTIONS you or your firm (as the Subscriber) will be charged fully with no discount for one year subscription to our Premium Plus Plan at $1,799.88 for EACH person or firm who received any of our content illegally through the respected intermediary’s (Subscriber in violation of terms) channel(s) of communication.
Recommended content
Editors’ Picks

EUR/USD tumbles to three-week lows near 1.0750
Fresh headlines mentioning the imminence of US tariffs on the European Union put EUR/USD under heavy pressure and send it to the area of multi-week lows around 1.0750 on Wednesday.

GBP/USD retests the 1.2870 zone, or two-week lows
The Greenback's upside impulse is now gathering extra steam and motivates GBP/USD to recede to the area of new two-week troughs around 1.2870.

Gold remains slightly offered just above $3,000
Gold is trading in a narrow range on Wednesday but continues to hold firm just above the $3,000 mark. The precious metal is drawing support from upbeat sentiment in the broader commodities space, buoyed by Copper’s surge to a fresh all-time high earlier in the day.

Bitcoin holds $87,000 as markets brace for volatility ahead of April 2 tariff announcements
Bitcoin (BTC) holds above $87,000 on Wednesday after its mild recovery so far this week. A K33 Research report explains how the markets are relatively calm and shaping up for volatility as the market absorbs the tariff announcements.

Sticky UK services inflation shows signs of tax hike impact
There are tentative signs that the forthcoming rise in employer National Insurance is having an impact on service sector inflation, which came in a tad higher than expected in February. It should still fall back in the second quarter, though, keeping the Bank of England on track for three further rate cuts this year.

The Best brokers to trade EUR/USD
SPONSORED Discover the top brokers for trading EUR/USD in 2025. Our list features brokers with competitive spreads, fast execution, and powerful platforms. Whether you're a beginner or an expert, find the right partner to navigate the dynamic Forex market.