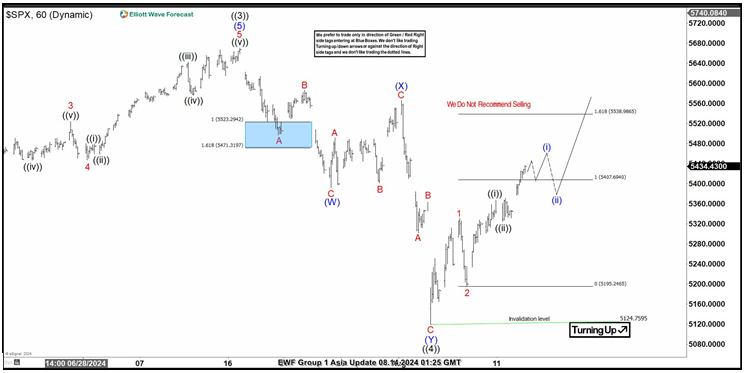
Short Term Elliott Wave View in SPX suggests the trend should continue higher within the sequence started from March 2023 low as the part of daily sequence. It favors upside in wave ((5)) while dips remain above 5124.76 low. Since March 2024 high of (3), it starts a correction as wave (4) ending in April at 4953.56 low and bounced again. The market resumed the rally building an impulse as wave (5) ended at 5669.67 high and also wave ((3)) in higher degree.

SPX begins a large retracement in July 16 high. Down from wave ((3)), the index dropped developing a double correction structure. First leg lower, built a zig zag correction to complete a wave (W) at 5390.95 low. Then, the market did a flat structure higher as wave (X) ended at 5566.16 high. The index resumed to the downside forming another zig zag as wave (Y) of ((4)). The cycle was completed at 5119.26 low and also wave ((4)). Actually, SPX has continued higher trading in wave (1) of ((5)). The wave 1 of (1) ended at 5330.64 high and wave 2 of (1) finished at 5195.54 low. The wave 3 of (1) started and we are expecting more upside. While price action stays above 5119.26 low, we are calling for more upside to continue the rally as wave ((5)).

SPX 60 minutes Elliott Wave chart

SP

SPX Elliott Wave [Video]

Share: Feed news

FURTHER DISCLOSURES AND DISCLAIMER CONCERNING RISK, RESPONSIBILITY AND LIABILITY Trading in the Foreign Exchange market is a challenging opportunity where above average returns are available for educated and experienced investors who are willing to take above average risk. However, before deciding to participate in Foreign Exchange (FX) trading, you should carefully consider your investment objectives, level of xperience and risk appetite. Do not invest or trade capital you cannot afford to lose. EME PROCESSING AND CONSULTING, LLC, THEIR REPRESENTATIVES, AND ANYONE WORKING FOR OR WITHIN WWW.ELLIOTTWAVE- FORECAST.COM is not responsible for any loss from any form of distributed advice, signal, analysis, or content. Again, we fully DISCLOSE to the Subscriber base that the Service as a whole, the individual Parties, Representatives, or owners shall not be liable to any and all Subscribers for any losses or damages as a result of any action taken by the Subscriber from any trade idea or signal posted on the website(s) distributed through any form of social-media, email, the website, and/or any other electronic, written, verbal, or future form of communication . All analysis, trading signals, trading recommendations, all charts, communicated interpretations of the wave counts, and all content from any media form produced by www.Elliottwave-forecast.com and/or the Representatives are solely the opinions and best efforts of the respective author(s). In general Forex instruments are highly leveraged, and traders can lose some or all of their initial margin funds. All content provided by www.Elliottwave-forecast.com is expressed in good faith and is intended to help Subscribers succeed in the marketplace, but it is never guaranteed. There is no “holy grail” to trading or forecasting the market and we are wrong sometimes like everyone else. Please understand and accept the risk involved when making any trading and/or investment decision. UNDERSTAND that all the content we provide is protected through copyright of EME PROCESSING AND CONSULTING, LLC. It is illegal to disseminate in any form of communication any part or all of our proprietary information without specific authorization. UNDERSTAND that you also agree to not allow persons that are not PAID SUBSCRIBERS to view any of the content not released publicly. IF YOU ARE FOUND TO BE IN VIOLATION OF THESE RESTRICTIONS you or your firm (as the Subscriber) will be charged fully with no discount for one year subscription to our Premium Plus Plan at $1,799.88 for EACH person or firm who received any of our content illegally through the respected intermediary’s (Subscriber in violation of terms) channel(s) of communication.

Recommended content


Recommended content

Editors’ Picks

GBP/USD drops below 1.2850 after UK inflation data

GBP/USD drops below 1.2850 after UK inflation data

GBP/USD came under renewed bearish pressure and dropped below 1.2850 in the European morning on Wednesday. The data from the UK showed that the annual core CPI inflation softened to 3.3% in July from 3.5%, causing Pound Sterling to lose interest.

GBP/USD News

EUR/USD hovers near 1.1000 ahead of Eurozone GDP, US CPI data

EUR/USD hovers near 1.1000 ahead of Eurozone GDP, US CPI data

The EUR/USD pair trades on a flat note near 1.0995 during the early European session on Wednesday. Traders prefer to wait on the sidelines ahead of the release of top-tier economic data from the Eurozone and the US. 

EUR/USD News

Gold price bulls remain on the sidelines ahead of the crucial US inflation data release

Gold price bulls remain on the sidelines ahead of the crucial US inflation data release

Gold price (XAU/USD) attracts some follow-through selling for the second straight day on Wednesday and moves further away from the monthly peak retested earlier this week. 

Gold News

Bitcoin retests its key resistance level around $62,000

Bitcoin retests its key resistance level around $62,000

Bitcoin and Ethereum prices are likely to decline as they near their key resistance levels, whereas Ripple is showing stability around the daily support level of $0.544, indicating the potential for a recovery.

Read more

US CPI data set to show inflation abating further in July towards 2% target

US CPI data set to show inflation abating further in July towards 2% target

The US Consumer Price Index is forecast to rise 2.9% YoY in July, at a softer pace than June’s 3% increase. Annual core CPI inflation is expected to soften to 3.2%. The inflation data could influence the probability of a 50 bps Fed rate cut in September.

Read more

Forex MAJORS

Cryptocurrencies

Signatures