|

Elliott Wave intraday analysis: NFLX should continue rally [Video]

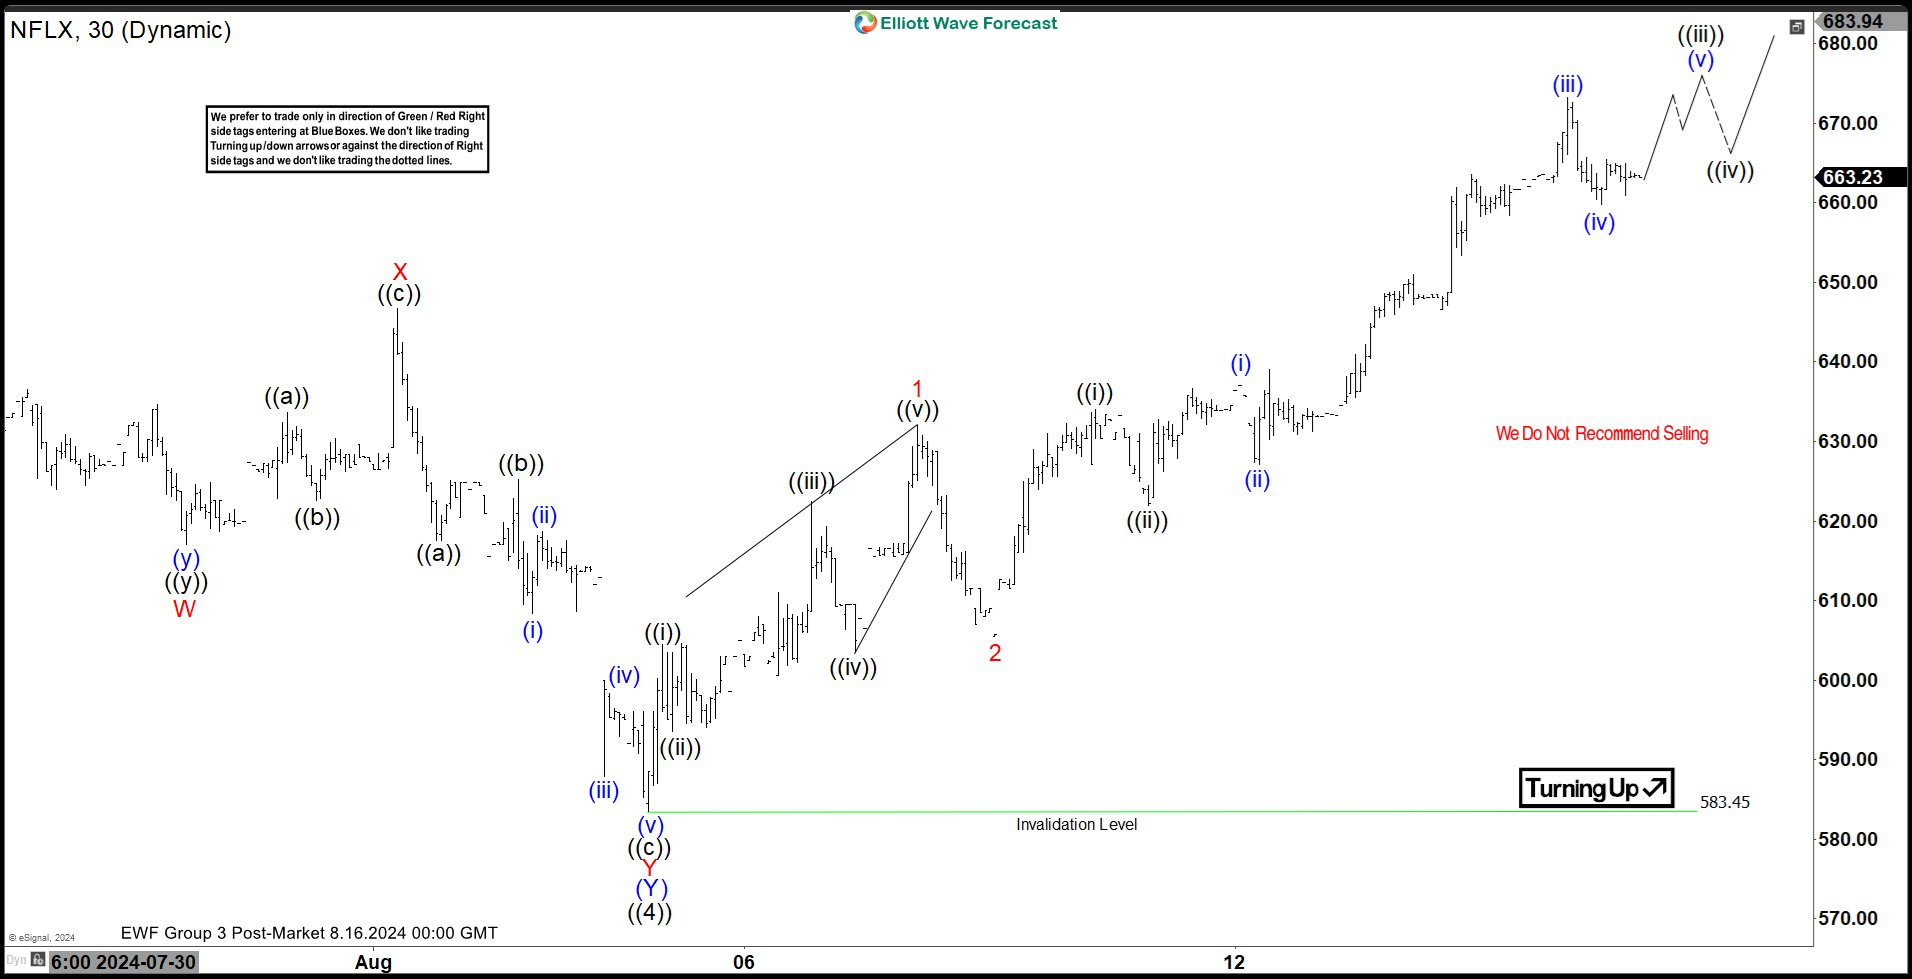
Short Term Elliott Wave in NFLX suggests that the Stock has completed a bearish sequence from 7.05.2024 high. The decline made a double correction Elliott Wave structure. Down from 7.05.2024 high, wave (W) ended at 600.00 low. Rally in wave (X) ended at 678.97 with internal subdivision as a zig zag correction structure. Up from wave (W), wave A ended at 655.54 and wave B ended at 631.50. Wave C higher ended at 678.97 which completed wave (X) in higher degree.

Then, NFLX turned lower in wave (Y) with internal subdivision as another double correction structure. Down from wave (X), wave W ended at 617.00 and wave X ended at 646.71. Last leg wave Y lower ended at 583.50 which completed wave (Y) and ((4)) in higher degree. The current rally is in progress expecting to continue higher as wave ((5)). Near term, we are calling a leading diagonal as wave 1 of (1) of ((5)). This wave 1 ended at 632.00 high and wave 2 pullback finished at 605.50. From this point, the stock resumed to the upside in wave 3 and once the wave 3 is completed, it should see 3, 7 or 11 swings correction as wave 4 before resuming the rally again.

NFLX 30 minutes Elliott Wave chart

Chart

NFLX Elliott Wave [Video]

Author

Elliott Wave Forecast Team

Elliott Wave Forecast Team

ElliottWave-Forecast.com

More from Elliott Wave Forecast Team
Share:

Editor's Picks

EUR/USD flirts with daily highs, retargets 1.1900

EUR/USD regains upside traction, returning to the 1.1880 zone and refocusing its attention to the key 1.1900 barrier. The pair’s slight gains comes against the backdrop of a humble decline in the US Dollar as investors continue to assess the latest US CPI readings and the potential Fed’s rate path.

GBP/USD remains well bid around 1.3650

GBP/USD maintains its upside momentum in place, hovering around daily highs near 1.3650 and setting aside part of the recent three-day drop. Cable’s improved sentiment comes on the back of the Greenback’s  irresolute price action, while recent hawkish comments from the BoE’s Pill also collaborate with the uptick.

Gold clings to gains just above $5,000/oz

Gold is reclaiming part of the ground lost on Wednesday’s marked decline, as bargain-hunters keep piling up and lifting prices past the key $5,000 per troy ounce. The precious metal’s move higher is also underpinned by the slight pullback in the US Dollar and declining US Treasury yields across the curve.

Crypto Today: Bitcoin, Ethereum, XRP in choppy price action, weighed down by falling institutional interest 

Bitcoin's upside remains largely constrained amid weak technicals and declining institutional interest. Ethereum trades sideways above $1,900 support with the upside capped below $2,000 amid ETF outflows.

Week ahead – Data blitz, Fed Minutes and RBNZ decision in the spotlight

US GDP and PCE inflation are main highlights, plus the Fed minutes. UK and Japan have busy calendars too with focus on CPI. Flash PMIs for February will also be doing the rounds. RBNZ meets, is unlikely to follow RBA’s hawkish path.

Ripple Price Forecast: XRP potential bottom could be in sight

Ripple edges up above the intraday low of $1.35 at the time of writing on Friday amid mixed price actions across the crypto market. The remittance token failed to hold support at $1.40 the previous day, reflecting risk-off sentiment amid a decline in retail and institutional sentiment.