|

Elliott Wave analysis on AMD suggest a double correction [Video]

Short Term Elliott Wave in AMD suggests the rally from 5.01.2024 low is in progress as an impulse. Up from 5.01.2024 low, wave (1) ended at 174.56 as the 30 minutes chart below showing. Wave (2) pullback is currently in progress. The internal subdivision of wave (2) takes the form of a double three Elliott Wave structure. Down from wave (2), wave ((a)) ended at 168.75 low and wave ((b)) bounce ended at 171.51. The stock extended lower in wave ((c)) towards 162.91 which completed wave W.

AMD 30 Minutes Elliott Wave chart

Chart

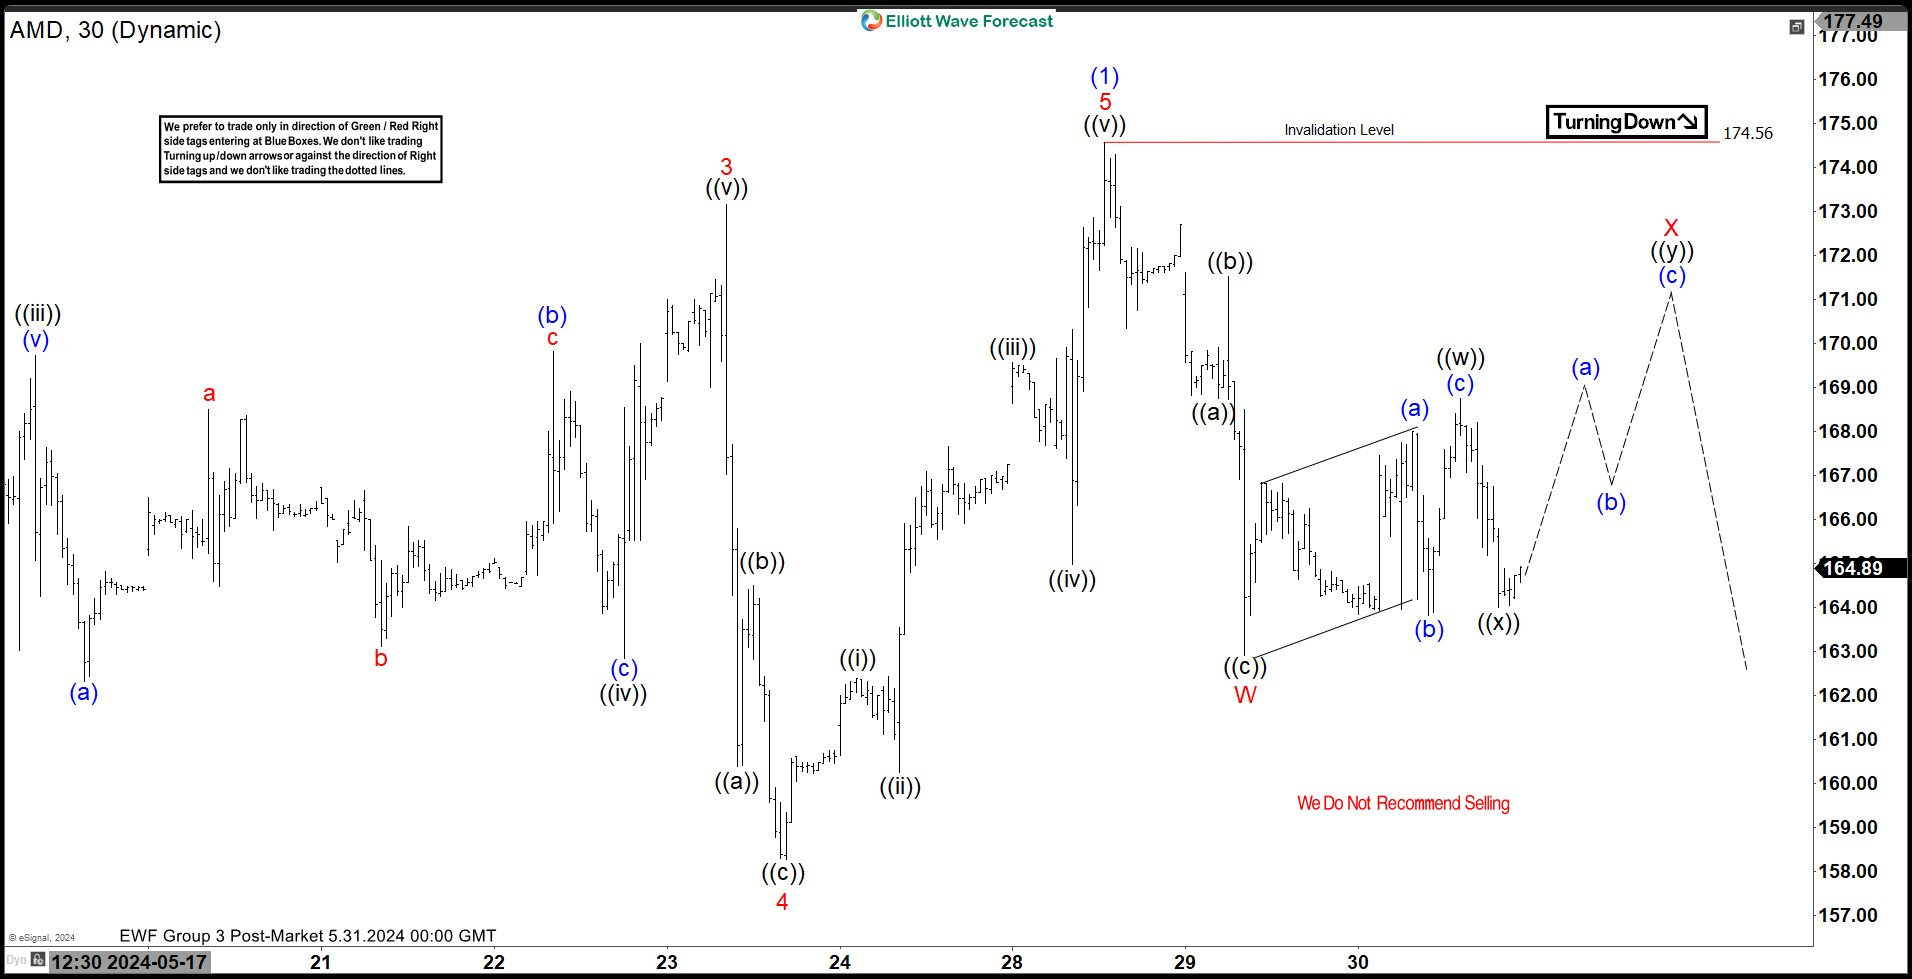
The market rallied starting wave X also taking the form of a double three Elliott Wave structure. Up from wave W, wave ((w)) ended at 168.75 and pullback in wave ((x)) ended at 164.00. Wave ((y)) higher is in progress. We are looking a bounce in 3 swings to 169.88 – 173.51 area to end wave ((y)) and also wave X connector. Near term, as far as pivot at 174.56 high stays intact, expect the stock to extend lower.

AMD Elliott Wave video

Author

Elliott Wave Forecast Team

Elliott Wave Forecast Team

ElliottWave-Forecast.com

More from Elliott Wave Forecast Team
Share:

Editor's Picks

EUR/USD weakens to near 1.1900 as traders eye US data

EUR/USD eases to near 1.1900 in Tuesday's European trading hours, snapping the two-day winning streak. Markets turn cautious, lifting the haven demand for the US Dollar ahead of the release of key US economic data, including Retail Sales and ADP Employment Change 4-week average.

GBP/USD stays in the red below 1.3700 on renewed USD demand

GBP/USD trades on a weaker note below 1.3700 in the European session on Tuesday. The pair faces challenges due to renewed US Dollar demand, UK political risks and rising expectations of a March Bank of England rate cut. The immediate focus is now on the US Retail Sales data. 

Gold sticks to modest losses above $5,000 ahead of US data

Gold sticks to modest intraday losses through the first half of the European session, though it holds comfortably above the $5,000 psychological mark and the daily swing low. The outcome of Japan's snap election on Sunday removes political uncertainty, which along with signs of easing tensions in the Middle East, remains supportive of the upbeat market mood. This turns out to be a key factor exerting downward pressure on the safe-haven precious metal.

Bitcoin Cash trades lower, risks dead-cat bounce amid bearish signals

Bitcoin Cash trades in the red below $522 at the time of writing on Tuesday, after multiple rejections at key resistance. BCH’s derivatives and on-chain indicators point to growing bearish sentiment and raise the risk of a dead-cat bounce toward lower support levels.

Follow the money, what USD/JPY in Tokyo is really telling you

Over the past two Tokyo sessions, this has not been a rate story. Not even close. Interest rate differentials have been spectators, not drivers. What has moved USD/JPY in local hours has been flow and flow alone.

Bitcoin Cash trades lower, risks dead-cat bounce amid bearish signals

Bitcoin Cash (BCH) trades in the red below $522 at the time of writing on Tuesday, after multiple rejections at key resistance. BCH’s derivatives and on-chain indicators point to growing bearish sentiment and raise the risk of a dead-cat bounce toward lower support levels.