Eli Lilly and Co. (LLY) Elliott Wave technical analysis [Video]
![Eli Lilly and Co. (LLY) Elliott Wave technical analysis [Video]](https://editorial.fxstreet.com/images/Markets/Equities/Industries/EnergyStocks/wind-power-637435385736549567_XtraLarge.jpg)
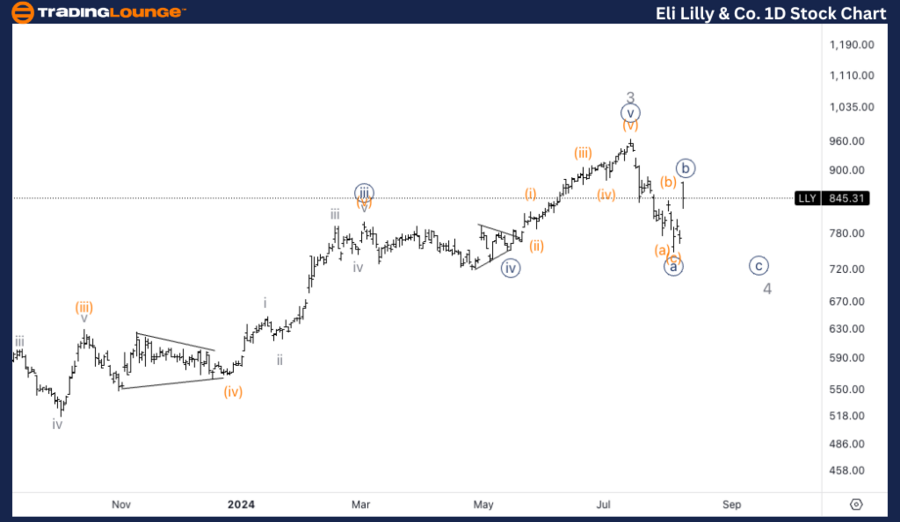
LLY Elliott Wave Analysis Trading Lounge Daily Chart,
Eli Lilly & Co.,(LLY) Daily Chart.
LLY Elliott Wave technical analysis
Function: Counter Trend.
Mode: Corrective.
Structure: Flat.
Position: Wave {b} of 4.
Direction: Top in wave {b}.
Details: Looking for a top in wave {b} of 4 to then complete the overall correction, knowing we could already have a bottom in Minor wave 4 in place.
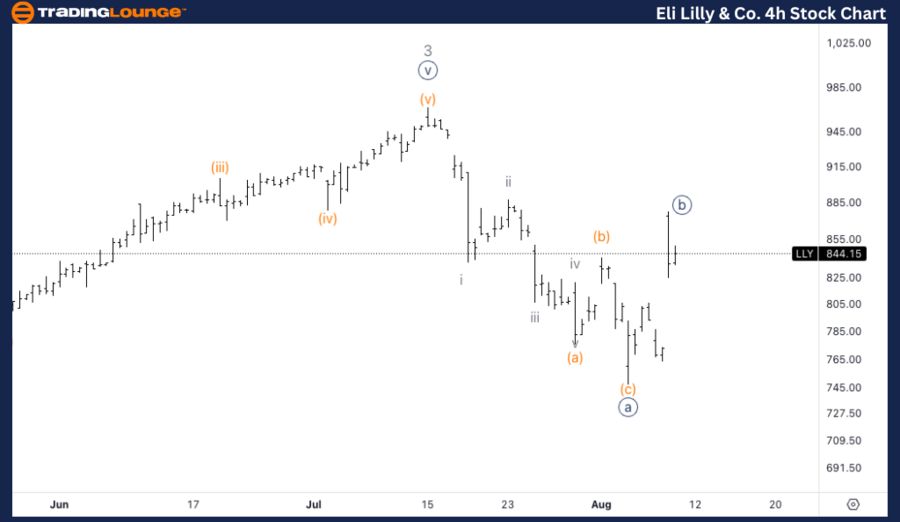
LLY Elliott Wave Analysis Trading Lounge 4H Chart,
Eli Lilly & Co., (LLY) 4H Chart.
LLY Elliott Wave technical analysis
Function: Counter Trend.
Mode: Corrective.
Structure: Flat.
Position: Wave (c) of {b}.
Direction: Top in wave (c).
Details: The fact we can count the initial move down in wave {a} as a three-wave move, making the potential wave 4 correction a flat, suggests there is a possibility wave 4 is already in place, as we also touched the area of the previous {iv}.
Welcome to our latest Elliott Wave analysis for Eli Lilly & Co. (LLY).. This analysis provides an in-depth look at LLY's price movements using the Elliott Wave Theory, helping traders identify potential opportunities based on current trends and market structure. We will cover insights from both the daily and 1-hour charts to offer a comprehensive perspective on LLY's market behavior.
LLY Elliott Wave technical analysis – Daily chart
We are anticipating a top in wave {b} of 4, which would then lead to the completion of the overall correction in wave 4. However, there is a possibility that Minor wave 4 has already bottomed. Traders should be cautious as the completion of wave {b} could signal the beginning of a move lower in wave {c} of 4.
LLY Elliott Wave technical analysis – Four-hour chart
The 4-hour chart shows that the initial move down in wave {a} was a three-wave structure, which is characteristic of a flat correction. This pattern suggests that the potential wave 4 correction might already be complete, especially since prices have touched the area of the previous wave {iv}. However, confirmation is needed to determine if wave 4 has indeed completed or if another leg lower is forthcoming.
Technical analyst: Alessio Barretta.
LLY Elliott Wave technical analysis [Video]
Author

Peter Mathers
TradingLounge
Peter Mathers started actively trading in 1982. He began his career at Hoei and Shoin, a Japanese futures trading company.


