Eicher Motors Elliott Wave technical analysis [Video]
![Eicher Motors Elliott Wave technical analysis [Video]](https://editorial.fxstreet.com/images/Markets/Equities/SP500/wall-street-sign-637299022550250958_XtraLarge.jpg)
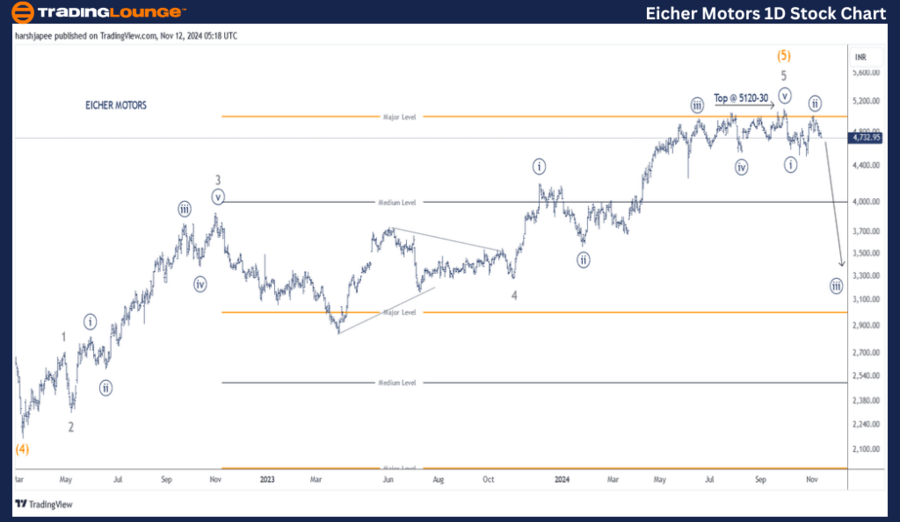
Eicher Motors – EICHERMOT (one day chart) Elliott Wave technical analysis
Function: Counter Trend (Minute degree, orange).
Mode: Corrective.
Structure: Impulse with larger degree correction.
Position: Minute Wave ((ii)) Navy.
Details: The structure might have turned lower against 5120-30 high, potential Intermediate Wave (5) termination. The first impulse drop Minute Wave ((i)) is complete and Minute Wave ((ii)) looks complete as prices turn lower from 5010 mark. Minute Wave ((iii)) is probably underway now.
Invalidation point: 5120.
EICHER MOTORS Daily Chart Technical Analysis and potential Elliott Wave Counts:
EICHER MOTORS daily chart is indicating a larger degree up trend potentially terminated around 5120-30 range, with Intermediate Wave (5) Orange complete. Furthermore, the stock has turned lower carving Minute Waves ((i)) and ((ii)) around 536 and 5010 levels respectively.
Earlier, the stock had dropped through 2175 lows in March 2022, terminating Intermediate Wave (4) Orange. The subsequent rally can be clearly subdivided into five waves Minor Wave 1 through 5 on the chart here.
If the above is correct, EICHER MOTORS have terminated its larger degree uptrend through 5120-30 range and turned lower as bears are inclined to remain in control.
Eicher Motors – EICHERMOT (four-hours chart) Elliott Wave technical analysis
Function: Counter Trend (Minute degree, orange).
Mode: Corrective.
Structure: Impulse with larger degree correction.
Position: Minute Wave ((ii)) Navy.
Details: The structure might have turned lower against 5120-30 high, potential Intermediate Wave (5) termination. The first impulse drop Minute Wave ((i)) is complete and Minute Wave ((ii)) looks complete as prices turn lower from 5010 mark. Minute Wave ((iii)) is probably underway now.
Invalidation point: 5120.
EICHER MOTORS 4H Chart Technical Analysis and potential Elliott Wave Counts:
EICHER MOTORS 4h chart highlights the lower degree wave counts after hitting highs around 5120 mark, terminating potential Intermediate Wave (5) Orange. The stock has carved Minute Wave ((i)) around 4536 followed by an expanded flat Minute Wave ((ii)) through 5010. If correct, Minute Wave ((iii)) is now dragging lower.
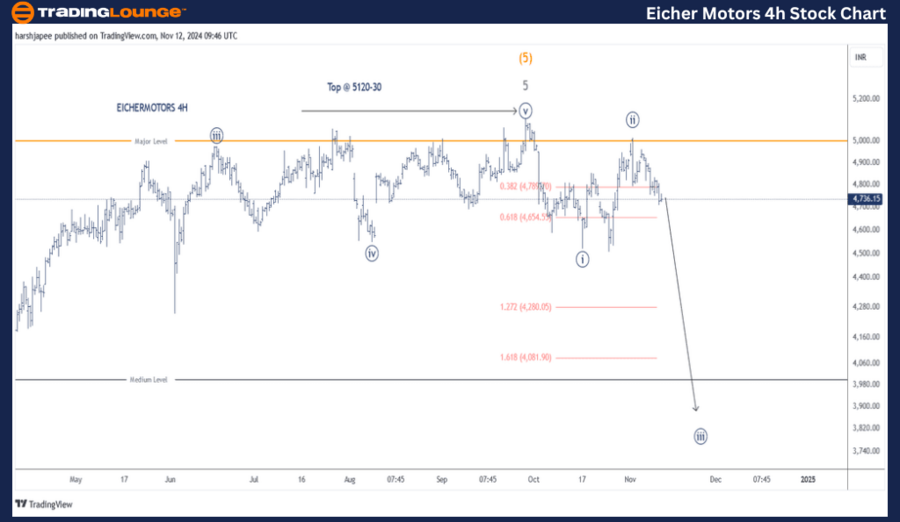
Conclusion:
EICHER MOTORS is dragging lower within Minute Wave ((iii)) against 5120-30 range.
Elliott Wave analyst: Harsh Japee.
Eicher Motors – EICHERMOT (one day chart) Elliott Wave technical analysis [Video]
Author

Peter Mathers
TradingLounge
Peter Mathers started actively trading in 1982. He began his career at Hoei and Shoin, a Japanese futures trading company.


