ETN Elliott Wave technical analysis
Function: Trend.
Mode: Impulsive.
Structure: Motive.
Position: Minor.
Direction: Upside within {v} of 5.
Details: We are looking for at least one more leg higher in wave (v) of {v} of 5 to then end a larger uptrend. Ideally the top of MG2 at around 380$ could provide resistance.
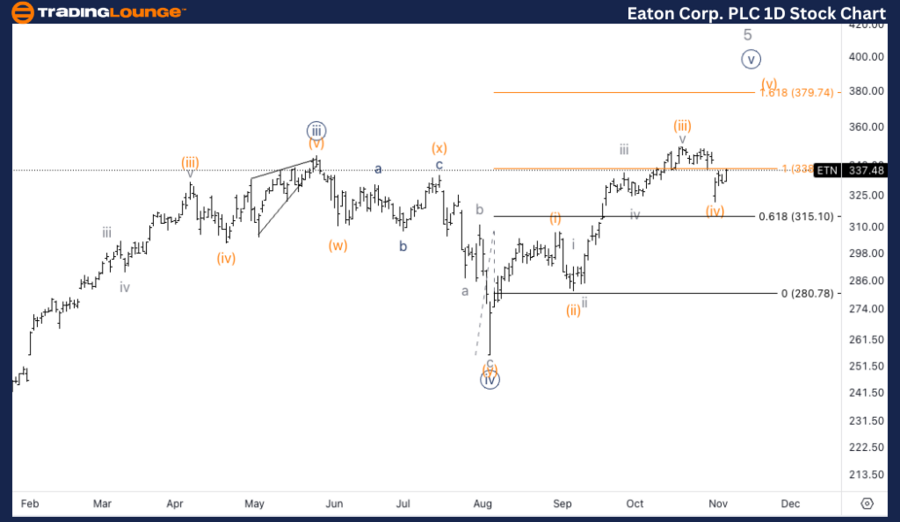
ETN Elliott Wave technical analysis – Daily chart
The daily chart indicates that Eaton is in the final stages of Minor wave 5, specifically in wave (v) of {v}. This suggests that at least one more leg higher is expected to complete the overall uptrend. The next significant resistance is projected to be around the Trading Level MG2, close to $380, where we could see a potential top form before a larger correction.
ETN Elliott Wave technical analysis
Function: Trend.
Mode: Impulsive.
Structure: Motive.
Position: Wave iii of (v).
Diection: Upside in wave (v).
Details: Looking at a three wave move in what appears to be wave (iv) which also found support on top of the parallel trend channel. AS we are trading above MG1, we could expect 350 to be the next target.
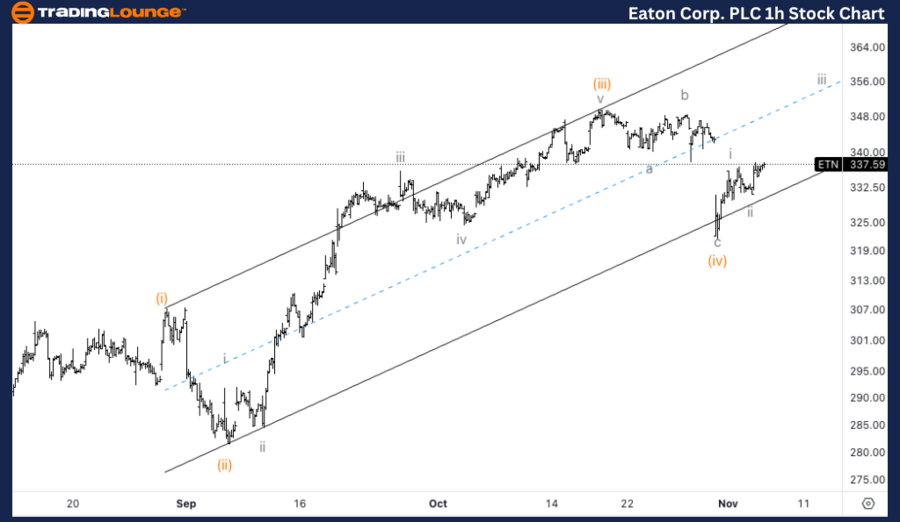
ETN Elliott Wave technical analysis – One-hour chart
On the 1-hour chart, ETN is in the process of completing wave iii of (v). The market appears to be working through wave (iv), which has shown a three-wave corrective structure and found support along a parallel trend channel. As long as the price holds above Trading Level MG1, the next target to the upside is $350, as wave (v) continues to push higher.
This analysis focuses on the current trend structure of Eaton Corp PLC, (ETN) utilizing the Elliott Wave Theory on both the daily and 1-hour charts. Below is a breakdown of the stock's position and potential future movements.
Eaton Corp PLC (ETN) Elliott Wave technical analysis [Video]
As with any investment opportunity there is a risk of making losses on investments that Trading Lounge expresses opinions on.
Historical results are no guarantee of future returns. Some investments are inherently riskier than others. At worst, you could lose your entire investment. TradingLounge™ uses a range of technical analysis tools, software and basic fundamental analysis as well as economic forecasts aimed at minimizing the potential for loss.
The advice we provide through our TradingLounge™ websites and our TradingLounge™ Membership has been prepared without considering your objectives, financial situation or needs. Reliance on such advice, information or data is at your own risk. The decision to trade and the method of trading is for you alone to decide. This information is of a general nature only, so you should, before acting upon any of the information or advice provided by us, consider the appropriateness of the advice considering your own objectives, financial situation or needs. Therefore, you should consult your financial advisor or accountant to determine whether trading in securities and derivatives products is appropriate for you considering your financial circumstances.
Recommended content
Editors’ Picks
EUR/USD retargets 1.0500 on extra Dollar weakness
The selling pressure around the US Dollar picks up pace and lifts EUR/USD to the area of two-day peaks near the 1.0480 level amid declining US and German yields.
Gold sets new record-high above $2,950
Gold retreats slightly but remains within a touching distance of the record-high it set above $2,950 in the European session on Thursday. Retreating US Treasury bond yields and the risk-averse market environment help XAU/USD hold its ground.
GBP/USD holds ground above 1.2600 after US data
GBP/USD stays in positive territory above 1.2600 on Thursday, supported by a sustained US Dollar weakness following the disappointing Jobless Claims data. The cautious market mood, however, seems to be limiting the pair's upside in the near term.
Bitcoin consolidation continues as market prepares for the next major move
Bitcoin has been consolidating between $94,000 and $100,000 since February 5. Glassnode reports weakening capital inflows and declining derivatives activity, with short-term holder accumulation resembling challenging market conditions.
Money market outlook 2025: Trends and dynamics in the Eurozone, US, and UK
We delve into the world of money market funds. Distinct dynamics are at play in the US, eurozone, and UK. In the US, repo rates are more attractive, and bills are expected to appreciate. It's also worth noting that the Fed might cut rates more than anticipated, similar to the UK. In the eurozone, unsecured rates remain elevated.
The Best brokers to trade EUR/USD
SPONSORED Discover the top brokers for trading EUR/USD in 2025. Our list features brokers with competitive spreads, fast execution, and powerful platforms. Whether you're a beginner or an expert, find the right partner to navigate the dynamic Forex market.