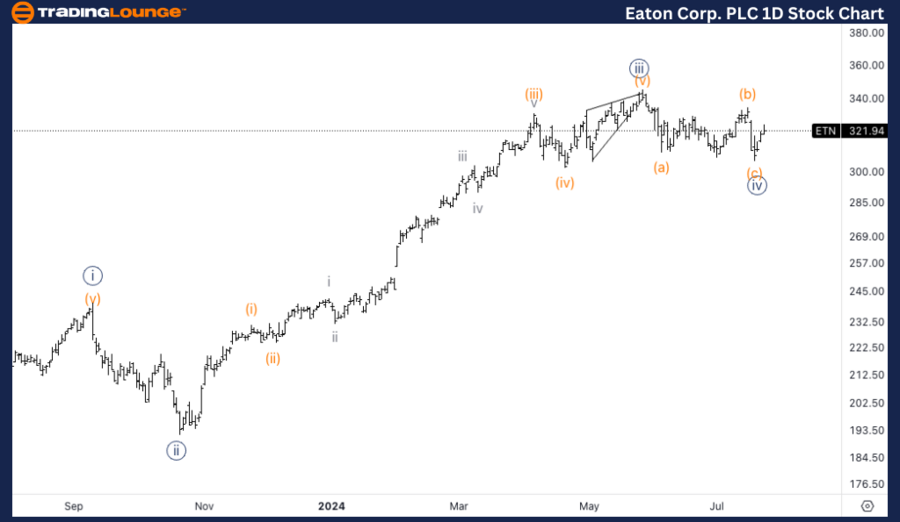
ETN Elliott Wave Analysis Trading Lounge Daily Chart,
Eaton Corp PLC, (ETN) Daily Chart.
ETN Elliott Wave technical analysis
Function: Trend.
Mode: Impulsive.
Structure: Motive.
Position: Minute {v}.
Direction: Upside in wave {v}.
Details: As we have had a clear three wave move into wave {iv} just shy of 0.618 {iv} vs. {ii}, we are finding support on top on MG1 which suggests further upside could come.
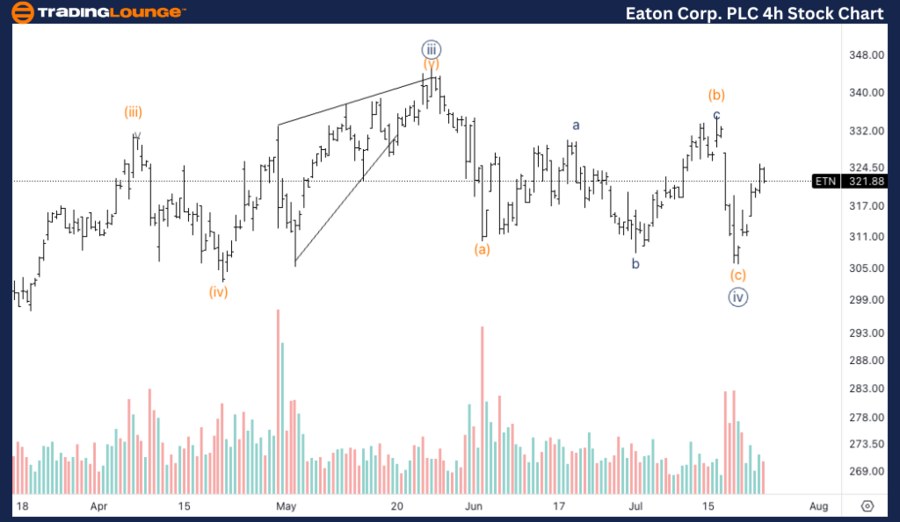
ETN Elliott Wave Analysis Trading Lounge 4H Chart,
Eaton Corp PLC, (ETN) 4H Chart
ETN Elliott Wave technical analysis
Function: Trend.
Mode: Impulsive.
Structure: Motive.
Positoin: Wave (i) of {v}.
Direction: Upside in wave {v}.
Details: Looking for a top in wave (i) of {v}, volume seems to suggests the low could be in place as we can see a spike in volume. Looking for a break and support on top of 320$ to then take off higher.
Welcome to our latest Elliott Wave analysis for Eaton Corp PLC (ETN). This analysis provides an in-depth look at ETN's price movements using the Elliott Wave Theory, helping traders identify potential opportunities based on current trends and market structure. We will cover insights from both the daily and 4-hour charts to offer a comprehensive perspective on ETN's market behavior.
ETN Elliott Wave technical analysis – Daily chart
The daily chart shows a clear three-wave move into wave {iv}, which ended just shy of the 0.618 retracement level of wave {ii}. Support is found on top of MG1, suggesting further upside potential in wave {v}. Traders should monitor the support level for confirmation of continued upward movement.
Four-hour chart
The 4-hour chart indicates a possible top in wave (i) of {v}, with volume spikes suggesting that a low could be in place. A break and support above $320 would provide further confirmation of the upward trend, setting the stage for a move higher in wave {v}.
Technical analyst: Alessio Barretta.
ETN Elliott Wave technical analysis [Video]
As with any investment opportunity there is a risk of making losses on investments that Trading Lounge expresses opinions on.
Historical results are no guarantee of future returns. Some investments are inherently riskier than others. At worst, you could lose your entire investment. TradingLounge™ uses a range of technical analysis tools, software and basic fundamental analysis as well as economic forecasts aimed at minimizing the potential for loss.
The advice we provide through our TradingLounge™ websites and our TradingLounge™ Membership has been prepared without considering your objectives, financial situation or needs. Reliance on such advice, information or data is at your own risk. The decision to trade and the method of trading is for you alone to decide. This information is of a general nature only, so you should, before acting upon any of the information or advice provided by us, consider the appropriateness of the advice considering your own objectives, financial situation or needs. Therefore, you should consult your financial advisor or accountant to determine whether trading in securities and derivatives products is appropriate for you considering your financial circumstances.
Recommended content
Editors’ Picks
EUR/USD stays in red below 1.0850 after weak German and EU PMI data
![EUR/USD stays in red below 1.0850 after weak German and EU PMI data](https://editorial.fxstreet.com/images/Markets/Currencies/Majors/EURUSD/photo-of-the-american-and-euro-banknotes-57153806_XtraSmall.jpg)
EUR/USD stays in negative territory below 1.0850 in the European session on Wednesday. Preliminary July PMI data from Germany and the Eurozone came in below analysts' estimates, making it difficult for the Euro to find demand. Focus now shifts to US PMI report.
GBP/USD recovers above 1.2900 following UK PMI
![GBP/USD recovers above 1.2900 following UK PMI](https://editorial.fxstreet.com/images/Markets/Currencies/Majors/GBPUSD/iStock-688526532_XtraSmall.jpg)
GBP/USD has found fresh demand and regained 1.2900 in the European session. The UK PMI data showed that the private sector continued to grow in July, lifting the Pound Sterling, despite the risk-averse market atmosphere. US PMI data are next on tap.
Gold trades higher on stagflation fears, Harris’ nomination
![Gold trades higher on stagflation fears, Harris’ nomination](https://editorial.fxstreet.com/images/Markets/Commodities/Metals/Gold/safe-investment-gm147311616-17537479_XtraSmall.jpg)
Gold recovers for a second day in a row, trading back up in the $2,410s as “stagflation” fears mount. The term, which describes above-trend inflation coupled with weak growth and jobs data, is a portmanteau of “stagnant” and “inflation”.
Bitcoin price volatility expected amid speculation of Kamala Harris joining Bitcoin Conference with Donald Trump
![Bitcoin price volatility expected amid speculation of Kamala Harris joining Bitcoin Conference with Donald Trump](https://editorial.fxstreet.com/images/Markets/Currencies/Digital%20Currencies/Bitcoin/bitcoin_forex_XtraSmall.jpg)
Bitcoin price struggles around $66,000 on Wednesday. US spot Bitcoin ETFs experienced minor outflows on Tuesday, coinciding with the continued movement of Mt. Gox funds for repayment, which could exert downward pressure on Bitcoin's price.
Canada Interest Rate Decision Preview: Bank of Canada eyes another rate cut on easing inflation expectation
![Canada Interest Rate Decision Preview: Bank of Canada eyes another rate cut on easing inflation expectation](https://editorial.fxstreet.com/images/Macroeconomics/Countries/America/Canada/map-and-flag-of-canada-11902476_XtraSmall.jpg)
The Canadian central bank is seen cutting rates for the second consecutive meeting and the decision will be announced at 13:45 GMT. Governor Tiff Macklem’s press conference will follow at 14:30 GMT.