Dr. Reddy 's Laboratories Elliott Wave technical analysis [Video]
![Dr. Reddy 's Laboratories Elliott Wave technical analysis [Video]](https://editorial.fxstreet.com/images/Markets/Equities/Industries/Pharma/man-looking-microscope_XtraLarge.jpg)
DRREDDY Elliott Wave technical analysis
Function: Counter Trend (Minor degree, Grey).
Mode: Corrective.
Structure: Zigzag/Flat unfolding.
Position: Impulse drop complete at Minuette Degree. Not labelled.
Details: A Minuette impulse wave looks complete within Minor Wave 4 Grey against 7110-20 mark. If correct, expect slight pullback higher before turning lower again.
Invalidation point: 7110-20.
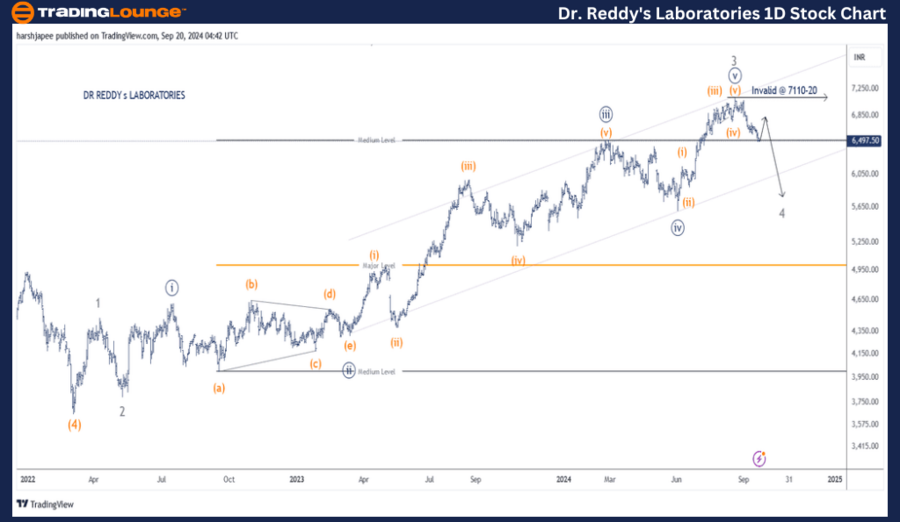
Dr Reddy s Laboratories Daily chart technical analysis and potential Elliott Wave counts
Dr Reddy s Laboratories daily chart is indicative of a potential correction underway towards 5600 levels as Minor Wave 4 progresses. Minor Wave 3 Grey looks complete at 7110, which was registered on August 21, 2024. Ideally, a zigzag is underway against that high.
Dr Reddy s had registered a low around 2645 mark in March 2022, terminating Intermediate Wave (4) Orange. Since then, Intermediate Wave (5) is progressing and has completed Minor Waves 1 through 3. Minute Wave ((iii)) is extended as marked on the chart, terminating around 6500-10 zone.
If the above proposed count is correct, Minor Wave 4 might be progressing towards 5600-10 range, the previous 4th wave of a lesser degree against 7110. Alternatively Minute Wave ((v)) is still progressing higher within Minor Wave 3 and could push above 7110-20 mark.
DRREDDY Elliott Wave technical analysis
Function: Counter Trend (Minor degree, Grey).
Mode: Corrective.
Structure: Zigzag/Flat unfolding.
Position: Impulse drop complete at Minuette Degree. Not labelled.
Details: A Minuette impulse wave looks complete within Minor Wave 4 Grey against 7110-20 mark. This could be Wave (a) of a potential Zigzag. If correct, expect slight pullback higher before turning lower again.
Invalidation point: 7110-20.
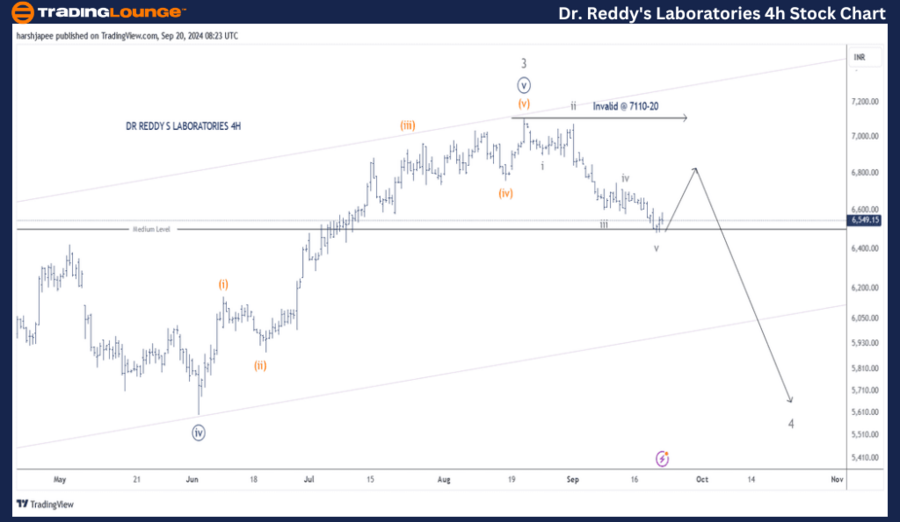
Dr Reddy s Laboratories four-hour chart technical analysis and potential Elliott Wave counts
Dr Reddy s Laboratories 4H chart is highlighting he sub waves within Minute Wave ((v)) of Minor Wave 3 and further. The above could be seen as an impulse and complete around 7110-20. Thereafter, the drop towards 6490 looks an impulse at Minuette degree.
If correct, prices should ideally push higher from here towards 6790 to complete a correction, before turning lower again.
Conclusion
Dr Reddy s Laboratories is progressing lower within a counter trend zigzag to terminate Minor Wave 4 Grey around 5600 levels. Once complete, the larger degree uptrend would resume higher towards 7110-20.
Dr. Reddy 's Laboratories Elliott Wave technical analysis [Video]
Author

Peter Mathers
TradingLounge
Peter Mathers started actively trading in 1982. He began his career at Hoei and Shoin, a Japanese futures trading company.


