- Dow Jones extends recent declines as investors pull back.
- US equities are broadly lower in the mid-week session.
- Declining bid-to-covers on Treasuries are spiking risk aversion.
The Dow Jones Industrial Average (DJIA) is broadly lower on Wednesday, shedding over 400 points and backsliding below 38,500.00. The major equity index is down nearly nine-tenths of a percent as investor sentiment sours.
Demand for Treasuries appears to be declining as bid-to-cover ratios on key Treasury auctions decline, putting downward pressure on equities and bolstering the safe haven US Dollar. An auction of 7-year Treasury notes on Wednesday showed a bid-to-cover ratio of 2.43, down from the previous 2.48. The US still has no trouble auctioning off bond issuance, but decreasing covering bids implies there could be declining interest in US bonds.
Wednesday is the last day of calm before the economic calendar kicks into high gear on US data, with Gross Domestic Product (GDP) and Personal Consumption Expenditures (PCE) inflation due on Thursday and Friday, respectively.
Annualized US Q1 GDP is expected to ease to 1.3% versus the previous 1.6% on Thursday. On Friday, US PCE Price Index inflation is forecast to hold steady at 0.3% MoM. With investors desperate for signs of rate cuts from the Federal Reserve (Fed), markets will be hoping that economic activity figures and inflation data will continue to ease.
Dow Jones news
The Dow Jones backslid to its lowest bids since the beginning of the month, and is sharply lower after hitting all-time highs above 40,000.00 recently. All but three of the Dow Jones’ component securities are in the red on Wednesday, with Unitedhealth Group Inc. (UNH) tumbling -3.76% to $484.72 per share, and declining nearly -19 points. On the high side, Salesforce Inc. (CRM) rose a scant 0.66%, climbing to $271.62 per share.
Dow Jones technical outlook
The Dow Jones’ Wednesday declines have dragged the index below the 50-day Exponential Moving Average (EMA) at 38,895.97, and the DJIA is on pace to add another red day to the chart. The index continues to hold above the 200-day EMA at 37,232.07, but equity losses have dragged the Dow Jones down -4% from a record peak just above 40,000.00.
Dow Jones five minute chart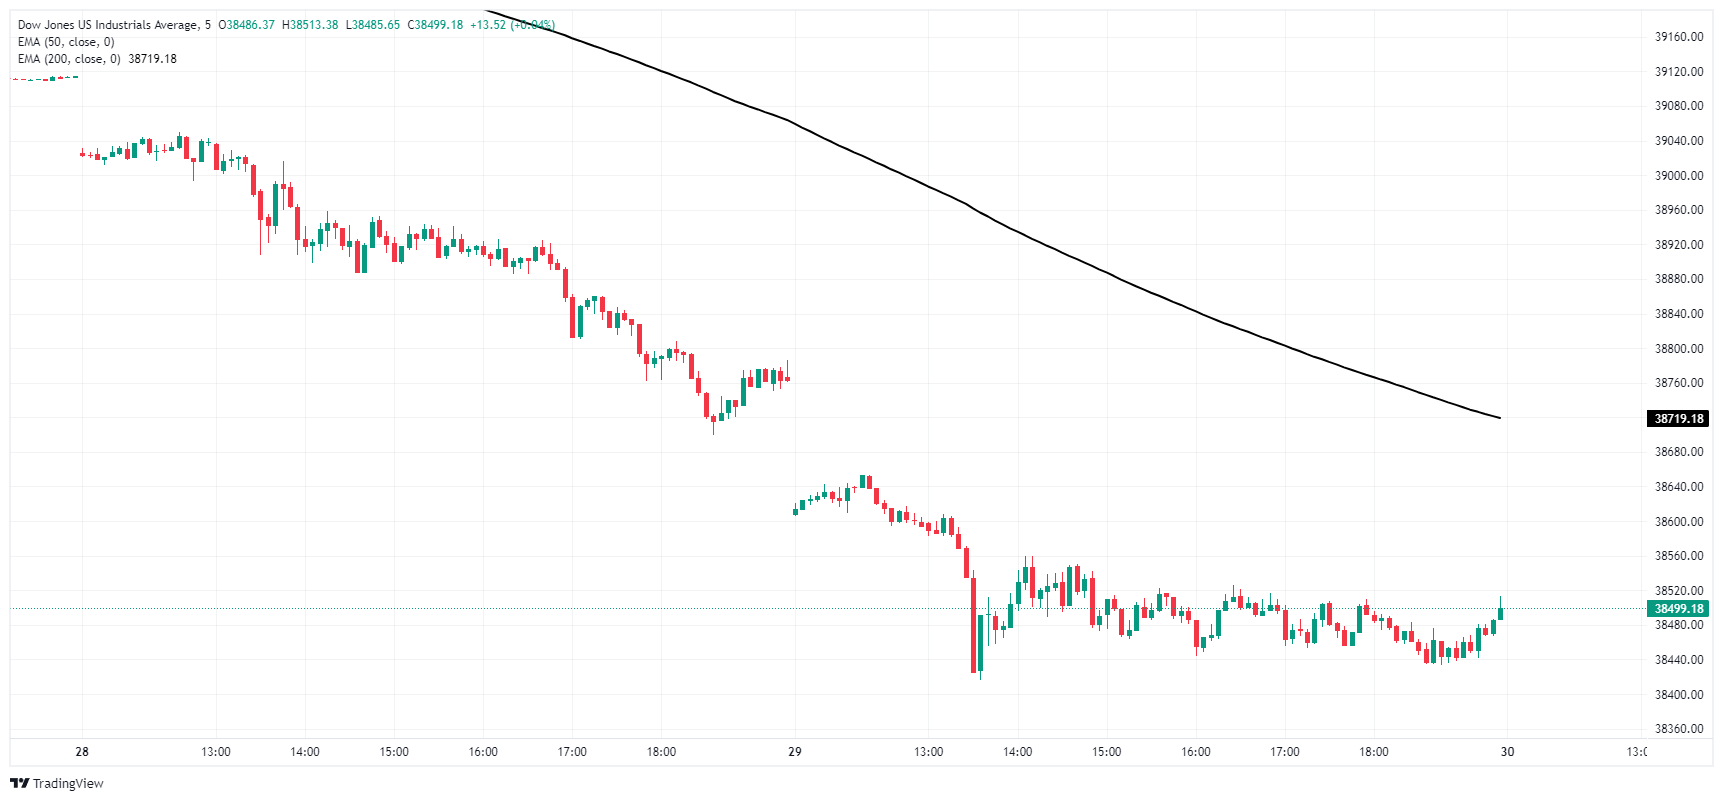
Dow Jones daily chart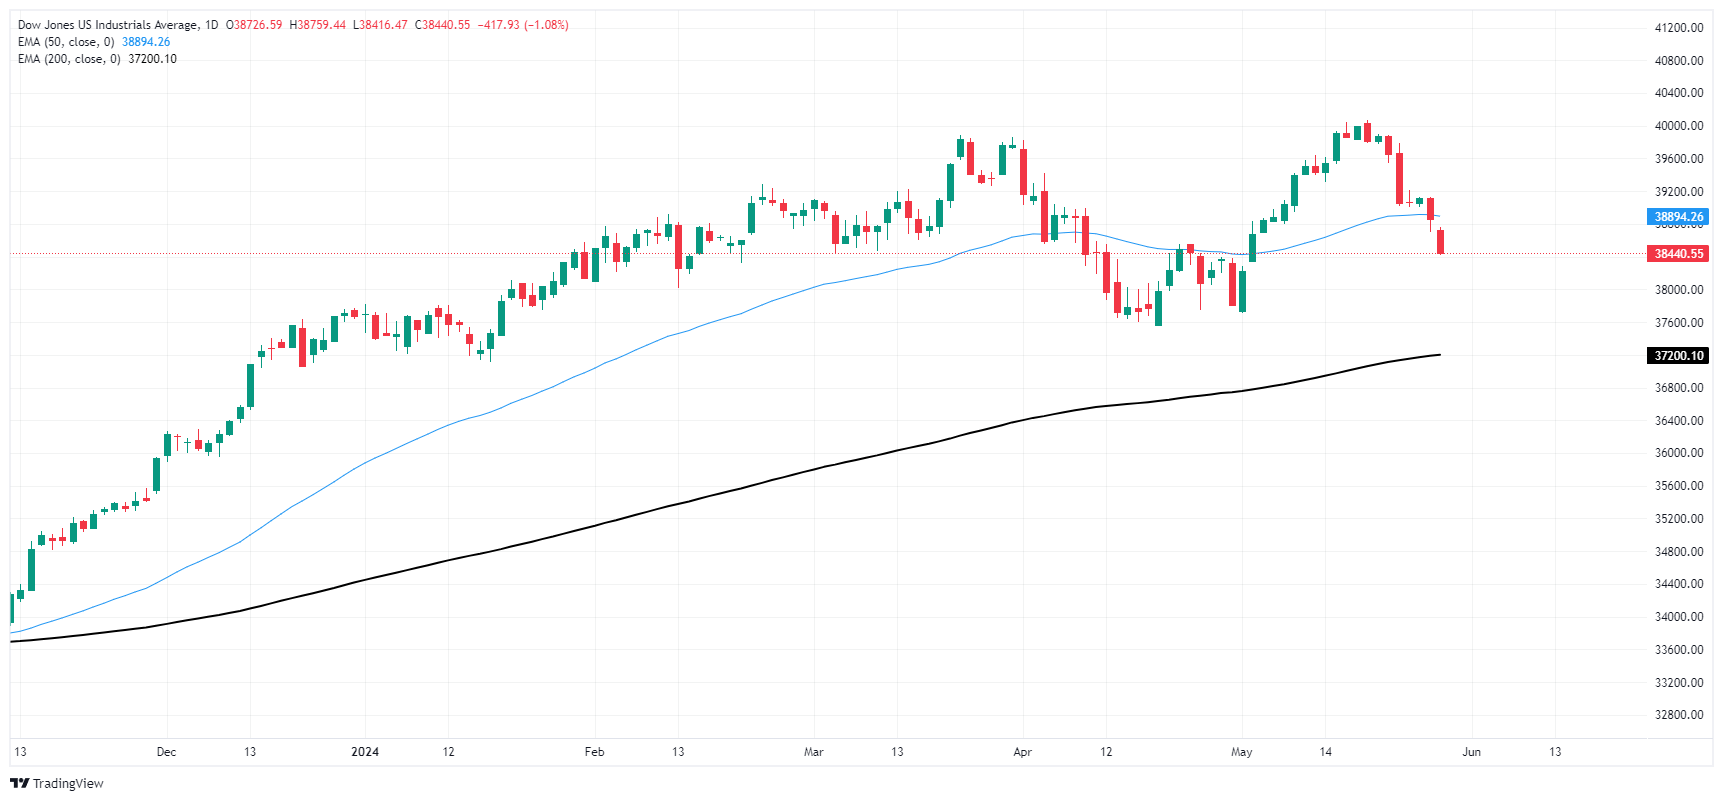
Dow Jones FAQs
The Dow Jones Industrial Average, one of the oldest stock market indices in the world, is compiled of the 30 most traded stocks in the US. The index is price-weighted rather than weighted by capitalization. It is calculated by summing the prices of the constituent stocks and dividing them by a factor, currently 0.152. The index was founded by Charles Dow, who also founded the Wall Street Journal. In later years it has been criticized for not being broadly representative enough because it only tracks 30 conglomerates, unlike broader indices such as the S&P 500.
Many different factors drive the Dow Jones Industrial Average (DJIA). The aggregate performance of the component companies revealed in quarterly company earnings reports is the main one. US and global macroeconomic data also contributes as it impacts on investor sentiment. The level of interest rates, set by the Federal Reserve (Fed), also influences the DJIA as it affects the cost of credit, on which many corporations are heavily reliant. Therefore, inflation can be a major driver as well as other metrics which impact the Fed decisions.
Dow Theory is a method for identifying the primary trend of the stock market developed by Charles Dow. A key step is to compare the direction of the Dow Jones Industrial Average (DJIA) and the Dow Jones Transportation Average (DJTA) and only follow trends where both are moving in the same direction. Volume is a confirmatory criteria. The theory uses elements of peak and trough analysis. Dow’s theory posits three trend phases: accumulation, when smart money starts buying or selling; public participation, when the wider public joins in; and distribution, when the smart money exits.
There are a number of ways to trade the DJIA. One is to use ETFs which allow investors to trade the DJIA as a single security, rather than having to buy shares in all 30 constituent companies. A leading example is the SPDR Dow Jones Industrial Average ETF (DIA). DJIA futures contracts enable traders to speculate on the future value of the index and Options provide the right, but not the obligation, to buy or sell the index at a predetermined price in the future. Mutual funds enable investors to buy a share of a diversified portfolio of DJIA stocks thus providing exposure to the overall index.
Information on these pages contains forward-looking statements that involve risks and uncertainties. Markets and instruments profiled on this page are for informational purposes only and should not in any way come across as a recommendation to buy or sell in these assets. You should do your own thorough research before making any investment decisions. FXStreet does not in any way guarantee that this information is free from mistakes, errors, or material misstatements. It also does not guarantee that this information is of a timely nature. Investing in Open Markets involves a great deal of risk, including the loss of all or a portion of your investment, as well as emotional distress. All risks, losses and costs associated with investing, including total loss of principal, are your responsibility. The views and opinions expressed in this article are those of the authors and do not necessarily reflect the official policy or position of FXStreet nor its advertisers. The author will not be held responsible for information that is found at the end of links posted on this page.
If not otherwise explicitly mentioned in the body of the article, at the time of writing, the author has no position in any stock mentioned in this article and no business relationship with any company mentioned. The author has not received compensation for writing this article, other than from FXStreet.
FXStreet and the author do not provide personalized recommendations. The author makes no representations as to the accuracy, completeness, or suitability of this information. FXStreet and the author will not be liable for any errors, omissions or any losses, injuries or damages arising from this information and its display or use. Errors and omissions excepted.
The author and FXStreet are not registered investment advisors and nothing in this article is intended to be investment advice.
Recommended content
Editors’ Picks

EUR/USD stays near 1.0400 in thin holiday trading
EUR/USD trades with mild losses near 1.0400 on Tuesday. The expectation that the US Federal Reserve will deliver fewer rate cuts in 2025 provides some support for the US Dollar. Trading volumes are likely to remain low heading into the Christmas break.

GBP/USD struggles to find direction, holds steady near 1.2550
GBP/USD consolidates in a range at around 1.2550 on Tuesday after closing in negative territory on Monday. The US Dollar preserves its strength and makes it difficult for the pair to gain traction as trading conditions thin out on Christmas Eve.

Gold holds above $2,600, bulls non-committed on hawkish Fed outlook
Gold trades in a narrow channel above $2,600 on Tuesday, albeit lacking strong follow-through buying. Geopolitical tensions and trade war fears lend support to the safe-haven XAU/USD, while the Fed’s hawkish shift acts as a tailwind for the USD and caps the precious metal.

IRS says crypto staking should be taxed in response to lawsuit
In a filing on Monday, the US International Revenue Service stated that the rewards gotten from staking cryptocurrencies should be taxed, responding to a lawsuit from couple Joshua and Jessica Jarrett.

2025 outlook: What is next for developed economies and currencies?
As the door closes in 2024, and while the year feels like it has passed in the blink of an eye, a lot has happened. If I had to summarise it all in four words, it would be: ‘a year of surprises’.

Best Forex Brokers with Low Spreads
VERIFIED Low spreads are crucial for reducing trading costs. Explore top Forex brokers offering competitive spreads and high leverage. Compare options for EUR/USD, GBP/USD, USD/JPY, and Gold.