Dow Jones Industrial Average backslides 160 points on Wednesday
- The Dow Jones shed half of a percent amid cautious market flows.
- The midweek market session has investors looking ahead to US PCE inflation.
- China GDP downgrade has investors concerned about physical trade.

The Dow Jones Industrial Average (DJIA) trimmed near-term gains on Wednesday, backsliding 160 points in the midweek market session. A downgrade to China’s Gross Domestic Product (GDP) forecast has investors concerned about a possible overhang in global trade, but most of the market is buckling down for the wait to Friday’s US Personal Consumption Expenditure Price Index (PCE) inflation print.
Equities pared back across the board after UBS trimmed its forecasts of Chinese GDP growth in 2024 and 2025. The Fitch ratings agency also issued a warning about performance in several of China’s business sectors in the second half of 2024 in a double-punch to market expectations of Chinese growth forecasts.
According to UBS, Chinese GDP growth is expected to clock in at 4.6% for 2024 compared to the previous expectation of 4.9%, and its 2025 forecast has been shifted down to just 4.0% from 4.6%. From Fitch Ratings, China’s ongoing property development slump is expected to remain a drag on issuers across several sectors, crimping growth and activity prospects in a measurable way through the last half of the year.
This week, investors will be closely watching Friday’s US PCE Price Index inflation reading for July. It is anticipated that YoY PCE inflation will increase to 2.7% from the current 2.6%, while the MoM figure is expected to remain unchanged at 0.2%. Those who are anticipating a reduction in interest rates will be looking for the inflation data to be lower than anticipated. However, if the inflation data exceeds expectations, it could unsettle investor sentiment and throw a wrench in current rate cut forecasts.
Dow Jones news
Tepid risk appetite on Wednesday has most of the Dow Jones in the red for the midweek market session. Gains are being led by Merck & Co Inc. (MRK), which rose around 0.6% to $163.90 per share, while Nike (NKE) fell 3.5% to $82.30 per share.
The moment is almost here. Despite a number of showstopping earnings calls this season, everyone has been waiting for Nvidia (NVDA) to release fiscal 2025 Q2 results, which finally arrive after the closing bell on Wednesday.
Dow Jones price forecast
The Dow Jones’ midweek pullback is picking up speed, with the equity index backsliding nine-tenths of one percent and shedding over 350 points. The DJIA has once again fallen below the 41,000 handle as near-term bullish momentum takes a pause and overextended price action snaps lower.
With bullish pressure running out of gas near fresh all-time highs beyond 41,250, bids are poised for an extended backslide to the 50-day Exponential Moving Average (EMA) rising through 40,000. Despite a near-term crimp in bidding momentum, short positions in the Dow Jones are unlikely to find a clear path all the way back to the index’s last major swing low below 38,500.
Dow Jones daily chart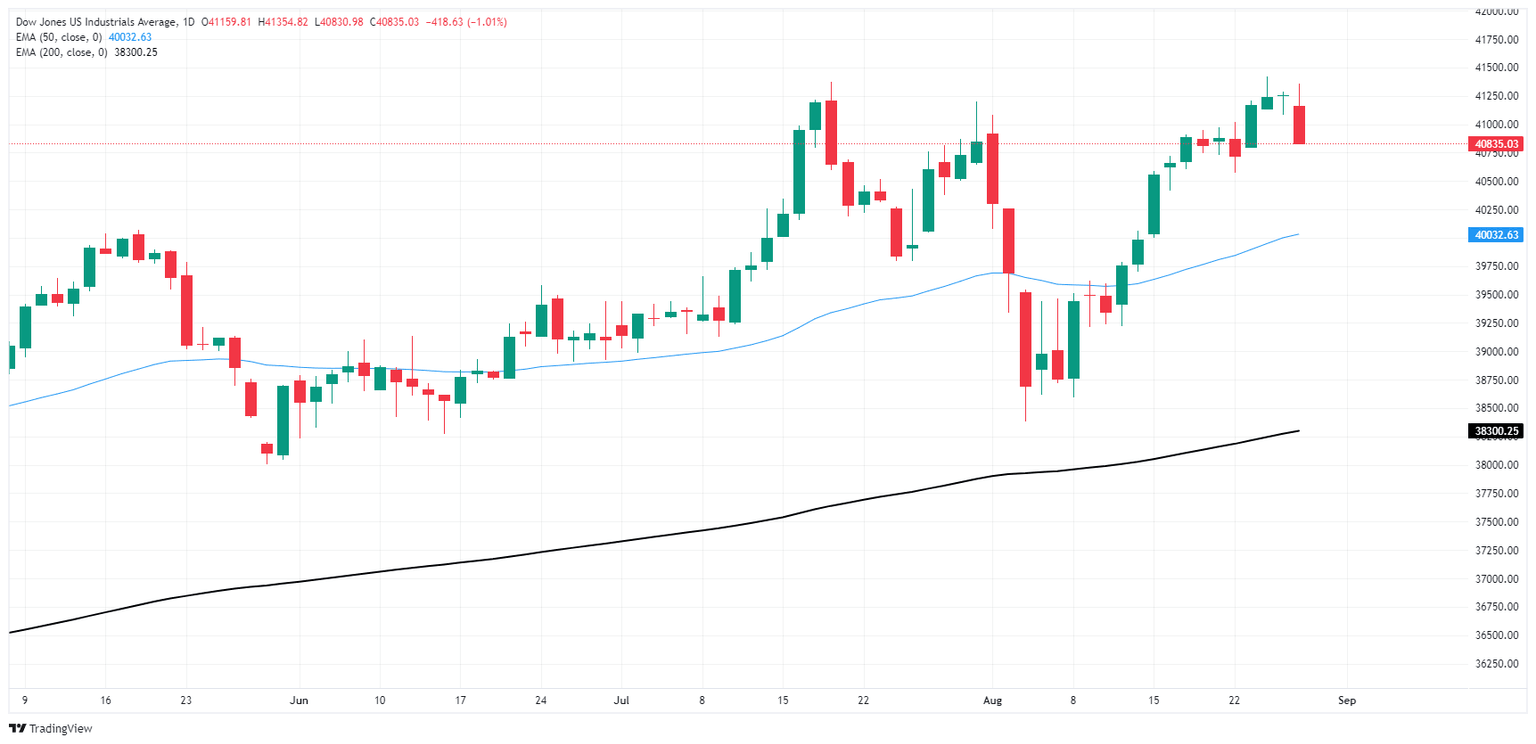
Dow Jones FAQs
The Dow Jones Industrial Average, one of the oldest stock market indices in the world, is compiled of the 30 most traded stocks in the US. The index is price-weighted rather than weighted by capitalization. It is calculated by summing the prices of the constituent stocks and dividing them by a factor, currently 0.152. The index was founded by Charles Dow, who also founded the Wall Street Journal. In later years it has been criticized for not being broadly representative enough because it only tracks 30 conglomerates, unlike broader indices such as the S&P 500.
Many different factors drive the Dow Jones Industrial Average (DJIA). The aggregate performance of the component companies revealed in quarterly company earnings reports is the main one. US and global macroeconomic data also contributes as it impacts on investor sentiment. The level of interest rates, set by the Federal Reserve (Fed), also influences the DJIA as it affects the cost of credit, on which many corporations are heavily reliant. Therefore, inflation can be a major driver as well as other metrics which impact the Fed decisions.
Dow Theory is a method for identifying the primary trend of the stock market developed by Charles Dow. A key step is to compare the direction of the Dow Jones Industrial Average (DJIA) and the Dow Jones Transportation Average (DJTA) and only follow trends where both are moving in the same direction. Volume is a confirmatory criteria. The theory uses elements of peak and trough analysis. Dow’s theory posits three trend phases: accumulation, when smart money starts buying or selling; public participation, when the wider public joins in; and distribution, when the smart money exits.
There are a number of ways to trade the DJIA. One is to use ETFs which allow investors to trade the DJIA as a single security, rather than having to buy shares in all 30 constituent companies. A leading example is the SPDR Dow Jones Industrial Average ETF (DIA). DJIA futures contracts enable traders to speculate on the future value of the index and Options provide the right, but not the obligation, to buy or sell the index at a predetermined price in the future. Mutual funds enable investors to buy a share of a diversified portfolio of DJIA stocks thus providing exposure to the overall index.
Author

Joshua Gibson
FXStreet
Joshua joins the FXStreet team as an Economics and Finance double major from Vancouver Island University with twelve years' experience as an independent trader focusing on technical analysis.


