- The Dow Jones tapped the 45,000 level for the first time ever.
- Despite an early upshot into a new record bid, the major index is trading softer.
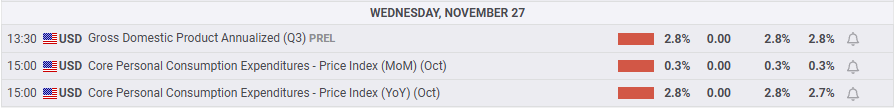
- US inflation and growth data met expectations, causing little stir.
The Dow Jones Industrial Average (DJIA) rose to another all-time high on Wednesday, tapping the 45,000 major price handle before settling back below the day’s opening bids near 44,750. Equities are turning tepid quickly as the US market space pivots into the upcoming Thanksgiving holiday on Thursday. Shorter hours on Friday further squeeze out the potential for momentum in the back half of the trading week.
Annualized US Gross Domestic Product (GDP) grew by the expected 2.8% through the third quarter, to no one's surprise and barely moving the needle on investor pulses. Core Personal Consumption Expenditure Price Index (PCEPI) accelerated to 2.8% for the year ended in October, also meeting expectations. While upticks in inflation metrics generally bode poorly for market expectations of future rate cuts, the move upward was widely expected, and a hold in monthly figures at 0.3% MoM helped to frame the bump in the data as being in the rear-view mirror.
Dow Jones news
After an early bump to test record highs, the Dow Jones is softening slightly, down around 100 points as of writing. Most of the major equity board’s listed securities are finding higher ground on the day, but concentrated losses in familiar tech stocks are dragging the averages lower.
Salesforce (CRM) fell over 3.5% to $330 per share as investors ease back on data management company that has been at the forefront of the AI integration space. CRM is slated to deliver its latest quarterly financials on December 3. Despite still being light on details about how a larger AI segment within the company will generate excess revenue, the generative data wave has propelled Salesforce to a $315 billion market cap, doubling its share price over the past five years.
Dow Jones price forecast
Despite pivoting into the red through the Wednesday trading session, the Dow Jones still set another record high, briefly piercing the 45,000 level for the first time ever. Despite all technical signals suggesting DJIA is overbought, bearish momentum has proven to be a trap rather than a successful entry point through most of 2024.
The Dow Jones is up around 20% YTD, and has outrun its own 200-day Exponential Moving Average (EMA), currently rising into 40,460, for over a year straight. A near-term floor is priced in at the 50-day EMA near 42,900, with the last swing low all the way down at the 42,000 handle.
Dow Jones daily chart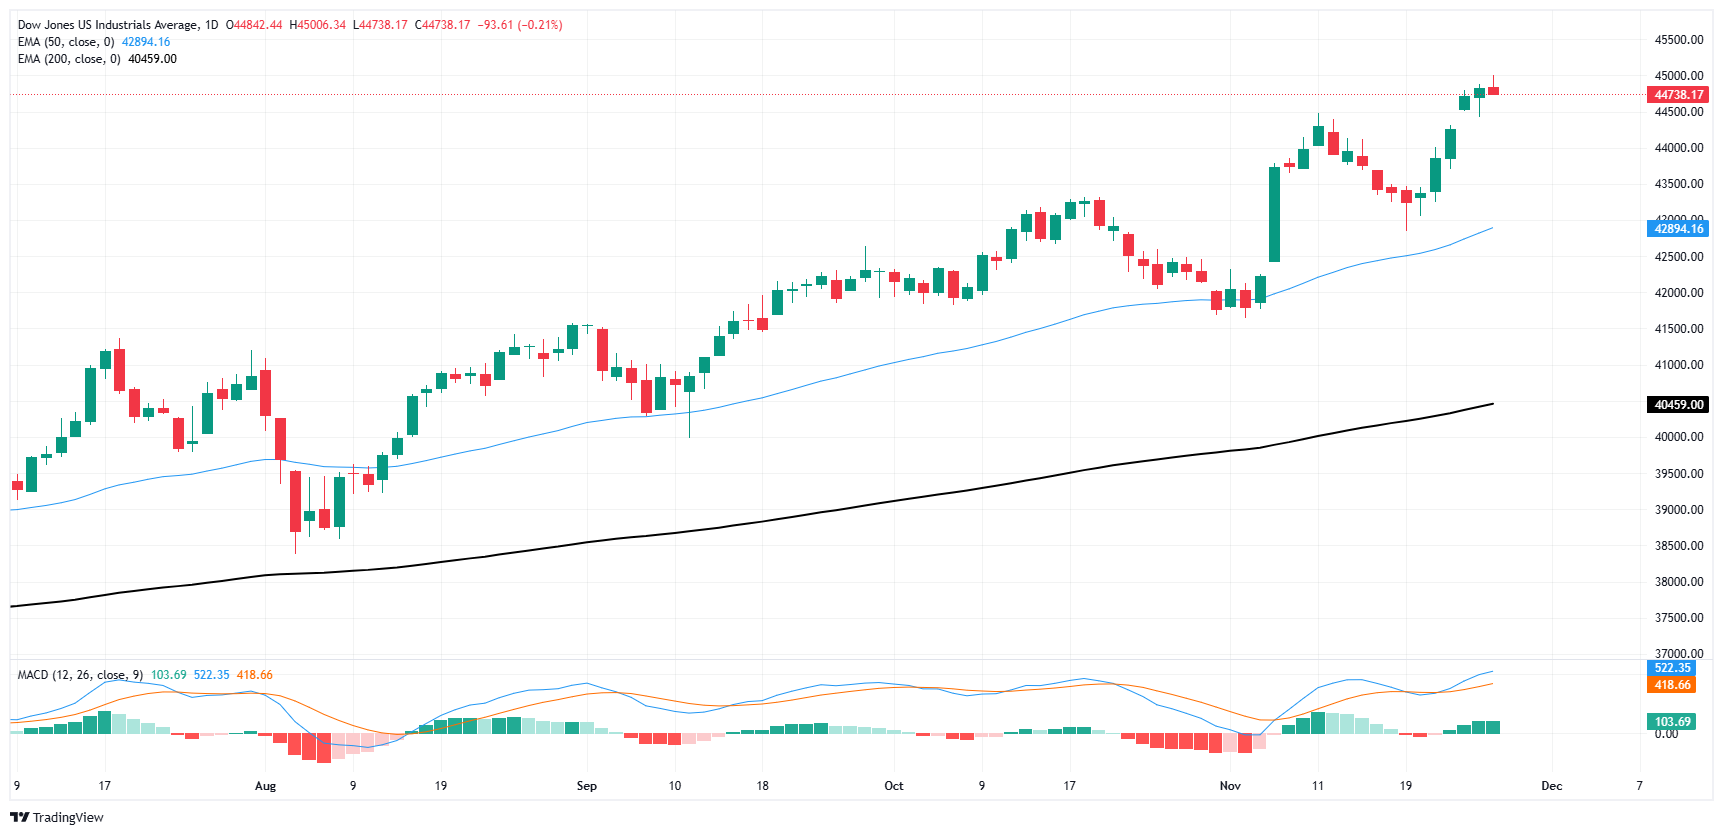
Dow Jones FAQs
The Dow Jones Industrial Average, one of the oldest stock market indices in the world, is compiled of the 30 most traded stocks in the US. The index is price-weighted rather than weighted by capitalization. It is calculated by summing the prices of the constituent stocks and dividing them by a factor, currently 0.152. The index was founded by Charles Dow, who also founded the Wall Street Journal. In later years it has been criticized for not being broadly representative enough because it only tracks 30 conglomerates, unlike broader indices such as the S&P 500.
Many different factors drive the Dow Jones Industrial Average (DJIA). The aggregate performance of the component companies revealed in quarterly company earnings reports is the main one. US and global macroeconomic data also contributes as it impacts on investor sentiment. The level of interest rates, set by the Federal Reserve (Fed), also influences the DJIA as it affects the cost of credit, on which many corporations are heavily reliant. Therefore, inflation can be a major driver as well as other metrics which impact the Fed decisions.
Dow Theory is a method for identifying the primary trend of the stock market developed by Charles Dow. A key step is to compare the direction of the Dow Jones Industrial Average (DJIA) and the Dow Jones Transportation Average (DJTA) and only follow trends where both are moving in the same direction. Volume is a confirmatory criteria. The theory uses elements of peak and trough analysis. Dow’s theory posits three trend phases: accumulation, when smart money starts buying or selling; public participation, when the wider public joins in; and distribution, when the smart money exits.
There are a number of ways to trade the DJIA. One is to use ETFs which allow investors to trade the DJIA as a single security, rather than having to buy shares in all 30 constituent companies. A leading example is the SPDR Dow Jones Industrial Average ETF (DIA). DJIA futures contracts enable traders to speculate on the future value of the index and Options provide the right, but not the obligation, to buy or sell the index at a predetermined price in the future. Mutual funds enable investors to buy a share of a diversified portfolio of DJIA stocks thus providing exposure to the overall index.
Information on these pages contains forward-looking statements that involve risks and uncertainties. Markets and instruments profiled on this page are for informational purposes only and should not in any way come across as a recommendation to buy or sell in these assets. You should do your own thorough research before making any investment decisions. FXStreet does not in any way guarantee that this information is free from mistakes, errors, or material misstatements. It also does not guarantee that this information is of a timely nature. Investing in Open Markets involves a great deal of risk, including the loss of all or a portion of your investment, as well as emotional distress. All risks, losses and costs associated with investing, including total loss of principal, are your responsibility. The views and opinions expressed in this article are those of the authors and do not necessarily reflect the official policy or position of FXStreet nor its advertisers. The author will not be held responsible for information that is found at the end of links posted on this page.
If not otherwise explicitly mentioned in the body of the article, at the time of writing, the author has no position in any stock mentioned in this article and no business relationship with any company mentioned. The author has not received compensation for writing this article, other than from FXStreet.
FXStreet and the author do not provide personalized recommendations. The author makes no representations as to the accuracy, completeness, or suitability of this information. FXStreet and the author will not be liable for any errors, omissions or any losses, injuries or damages arising from this information and its display or use. Errors and omissions excepted.
The author and FXStreet are not registered investment advisors and nothing in this article is intended to be investment advice.
Recommended content
Editors’ Picks

EUR/USD drops below 1.0450 as USD gathers strength
EUR/USD stays on the back foot and trades below 1.0450 on Wednesday. The cautious market stance helps the US Dollar (USD) stay resilient against its rivals and weighs on the pair as markets wait for the Federal Reserve to publish the minutes of the January policy meeting.

Gold climbs to new all-time high near $2,950
Gold retreats slightly from the all-time high it touched at $2,947 but manages to stay above $2,930 on Wednesday. The benchmark 10-year US Treasury bond yield clings to modest gains above 4.55%, limiting XAU/USD's upside.

GBP/USD retreats below 1.2600 despite strong UK inflation data
GBP/USD struggles to hold its ground and trades in the red below 1.2600 on Wednesday. Earlier in the day, the data from the UK showed that the annual CPI inflation climbed to 3% in January from 2.5% in December. Market focus shifts to FOMC Minutes.

Maker Price Forecast: MKR generates highest daily revenue of $10 million
Maker (MKR) price extends its gains by 6%, trading around $1,189 on Wednesday after rallying more than 20% so far this week. Artemis data shows that MKR generated $10 million in revenue on February 10, the new yearly high in daily revenue.

Money market outlook 2025: Trends and dynamics in the Eurozone, US, and UK
We delve into the world of money market funds. Distinct dynamics are at play in the US, eurozone, and UK. In the US, repo rates are more attractive, and bills are expected to appreciate. It's also worth noting that the Fed might cut rates more than anticipated, similar to the UK. In the eurozone, unsecured rates remain elevated.

The Best Brokers of the Year
SPONSORED Explore top-quality choices worldwide and locally. Compare key features like spreads, leverage, and platforms. Find the right broker for your needs, whether trading CFDs, Forex pairs like EUR/USD, or commodities like Gold.