Dow Jones Industrial Average sheds weight as tariffs come into effect
- The Dow Jones lost 650 points on Tuesday, falling to 42,500.
- Trump’s new and improved trade war kicked off with new tariffs on Canada and Mexico.
- US data remains limited through the midweek as politics and policy headlines dominate.

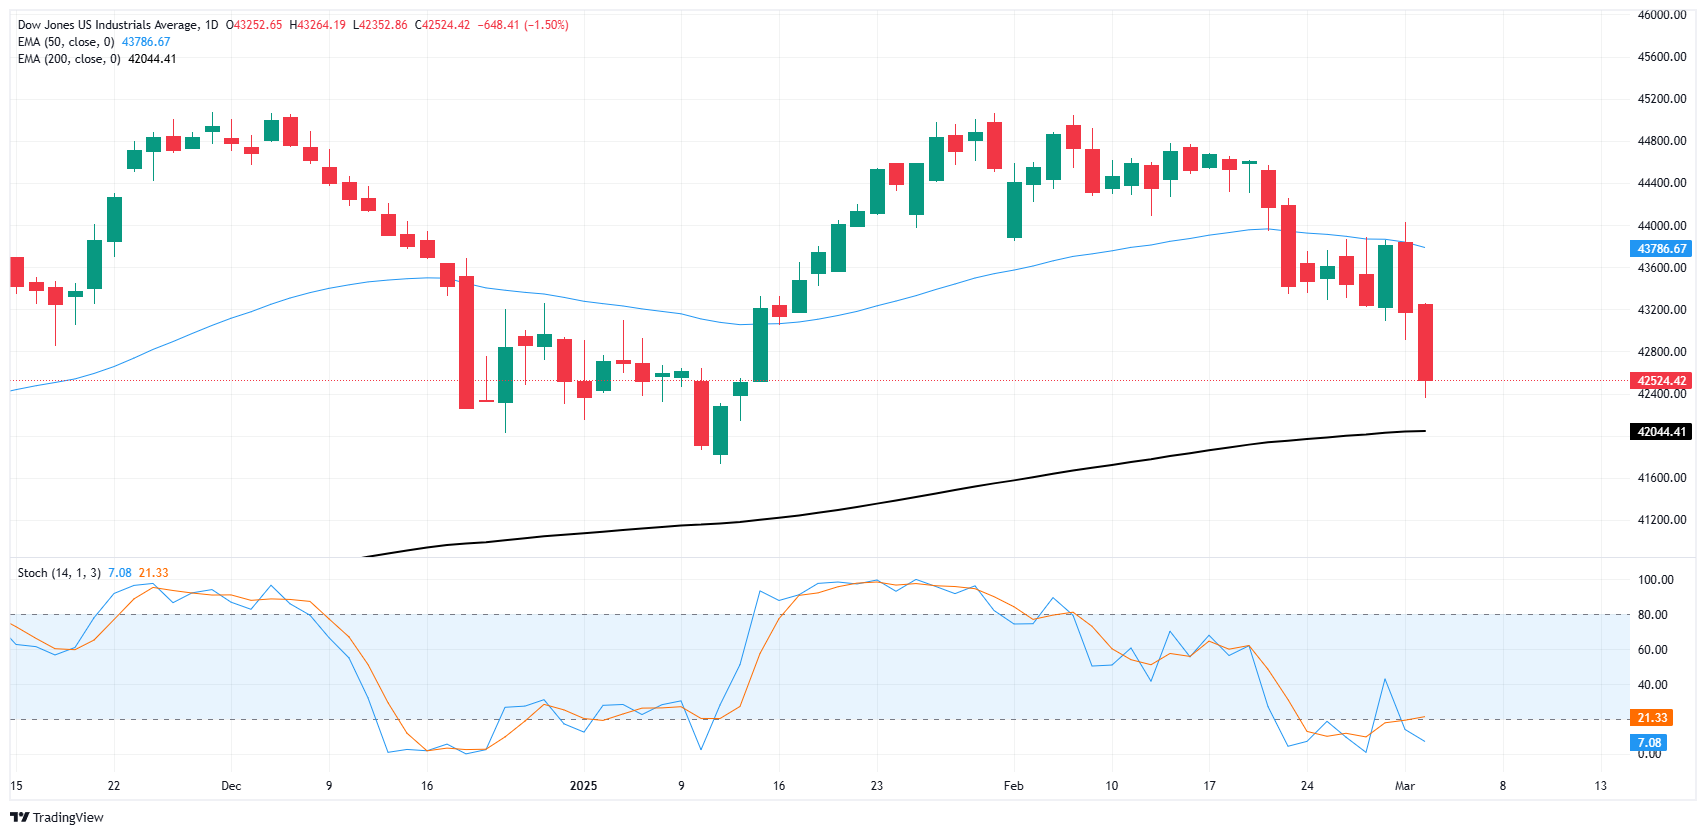
The Dow Jones Industrial Average (DJIA) tumbled 700 points at its lowest on Tuesday as investor sentiment hits the floorboards. After the initial sticker shock on new import taxes, markets recovered some footing, but the Dow Jones remains down around 650 points.
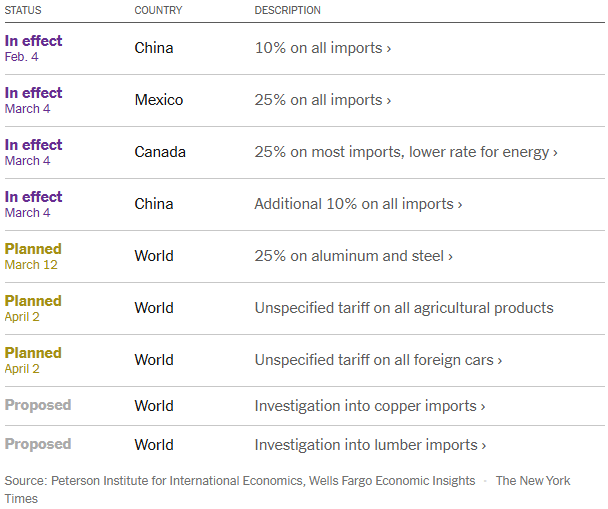
United States (US) President Donald Trump has kicked off his second, bigger global trade war by imposing a stiff 25% tariff on all imported goods from Canada and Mexico, as well as adding on an additional 10% import tax on China, bringing China’s tariff total to 20%. Further tariff packages are still in the oven, with the Trump administration planning to target aluminum, steel, agriculture goods, foreign cars, copper, and lumber.
Rate markets are now pricing in around 100 bps of interest rate cuts through the end of the year, with the first quarter-point rate trim expected in June. ADP Employment Change figures are due on Wednesday and will serve as a preview of this Friday’s upcoming Nonfarm Payrolls (NFP) jobs report. Markets will be watching economic figures with renewed anxiety as investors hunker down for negative impacts from President Trump’s sweeping tariff packages.
Dow Jones news
The overwhelming majority of securities listed on the Dow Jones are in the red on Tuesday, with slim recovery gains in UnitedHealth (UNH) and Nvidia (NVDA), which gained around 1.8% and 1.1%, respectively. UNH is trading back above $475 per share, while Nvidia is grappling with $115.
Boeing (BA) tumbled 5.5% to $160 per share, with American Express (AXP) and 3M (MMM) falling around 4.5% apiece, to $281 and $146 per share, respectively. Entire industry sectors are falling back in their own reactions to tariffs, with key losses concentrated in financials.
Dow Jones price forecast
Tuesday’s backslide puts the Dow Jones Industrial Average on pace to make contact with the 200-day Exponential Moving Average (EMA) near 42,060 for the first time since November of 2023. The Dow Jones has fallen nearly 1,700 points in two days top-to-bottom, shedding 3.8% in the process.
Momentum is fully in the bears’ control in the near-term, but the 42,000 price handle could prove to be a major challenge to further downside unless market fundamentals continue to roil. Technical oscillators remain in oversold territory, and could signal a prime opportunity for a bullish recovery if bidders gather themselves in time.
Dow Jones daily chart
Dow Jones FAQs
The Dow Jones Industrial Average, one of the oldest stock market indices in the world, is compiled of the 30 most traded stocks in the US. The index is price-weighted rather than weighted by capitalization. It is calculated by summing the prices of the constituent stocks and dividing them by a factor, currently 0.152. The index was founded by Charles Dow, who also founded the Wall Street Journal. In later years it has been criticized for not being broadly representative enough because it only tracks 30 conglomerates, unlike broader indices such as the S&P 500.
Many different factors drive the Dow Jones Industrial Average (DJIA). The aggregate performance of the component companies revealed in quarterly company earnings reports is the main one. US and global macroeconomic data also contributes as it impacts on investor sentiment. The level of interest rates, set by the Federal Reserve (Fed), also influences the DJIA as it affects the cost of credit, on which many corporations are heavily reliant. Therefore, inflation can be a major driver as well as other metrics which impact the Fed decisions.
Dow Theory is a method for identifying the primary trend of the stock market developed by Charles Dow. A key step is to compare the direction of the Dow Jones Industrial Average (DJIA) and the Dow Jones Transportation Average (DJTA) and only follow trends where both are moving in the same direction. Volume is a confirmatory criteria. The theory uses elements of peak and trough analysis. Dow’s theory posits three trend phases: accumulation, when smart money starts buying or selling; public participation, when the wider public joins in; and distribution, when the smart money exits.
There are a number of ways to trade the DJIA. One is to use ETFs which allow investors to trade the DJIA as a single security, rather than having to buy shares in all 30 constituent companies. A leading example is the SPDR Dow Jones Industrial Average ETF (DIA). DJIA futures contracts enable traders to speculate on the future value of the index and Options provide the right, but not the obligation, to buy or sell the index at a predetermined price in the future. Mutual funds enable investors to buy a share of a diversified portfolio of DJIA stocks thus providing exposure to the overall index.
Author

Joshua Gibson
FXStreet
Joshua joins the FXStreet team as an Economics and Finance double major from Vancouver Island University with twelve years' experience as an independent trader focusing on technical analysis.


