Dow Jones Industrial Average drops 300 points during holiday pullback
- The Dow Jones shed 300 points on Monday as investors recoil at the year-end.
- The broad-market tech rally that bolstered indexes to record highs in 2024 looks set to evaporate.
- Most investors are sitting on the sidelines ahead of the midweek holiday closure.
The Dow Jones Industrial Average (DJIA) shed over 300 points on Monday, plunging to a near-term low just south of 42,300 before a half-hearted recovery back to 42,500 as equities swoon in one of the last trading days of the year. The broad-market tech rally, buoyed into lofty heights by even loftier investor expectations for the AI-fueled future, looks set to drain out of the markets for the time being.
Markets are hurtling toward the new trading year on decidedly softer footing. The Dow Jones is down 5.5% from record highs set in late November following a two-week period of straight daily declines, a feat the index hasn’t achieved since the 1970s. Markets hit the holiday season in a flat spin, keeping the Dow Jones from further declines but also preventing a meaningful bullish recovery.
After the midweek market closure for the New Year’s Day holiday, traders will be returning to the fold en masse in a much trickier environment than they expected through most of 2024. The Federal Reserve (Fed) has clamped down on the number of rate cuts it expects to deliver in 2025, forecasting a meager two 25 bps rate cuts through the calendar year before pausing. Despite the Fed’s insistence that their approach to interest rates remains ‘data dependent’, investors will have a hard time believing that incoming President Donald Trump’s strategy of sparking a trade war with everybody at the same time won’t have at least a marginal impact on the Fed’s policy stance.
Dow Jones news
The Dow Jones is broadly lower on Monday, with all but one of the index’s listed securities tilting into the red on the day. Nvidia (NVDA) is the only bright spot on the DJIA, rising a little over 2% and knocking on $140 per share. On the low side, Boeing (BA) and Nike (NKE) are in a dead heat race to the bottom, both shedding around 1.7% since the day’s opening bell. Boeing has fallen below $178 per share while Nike is testing $75 per share after falling to four-week lows.
Dow Jones price forecast
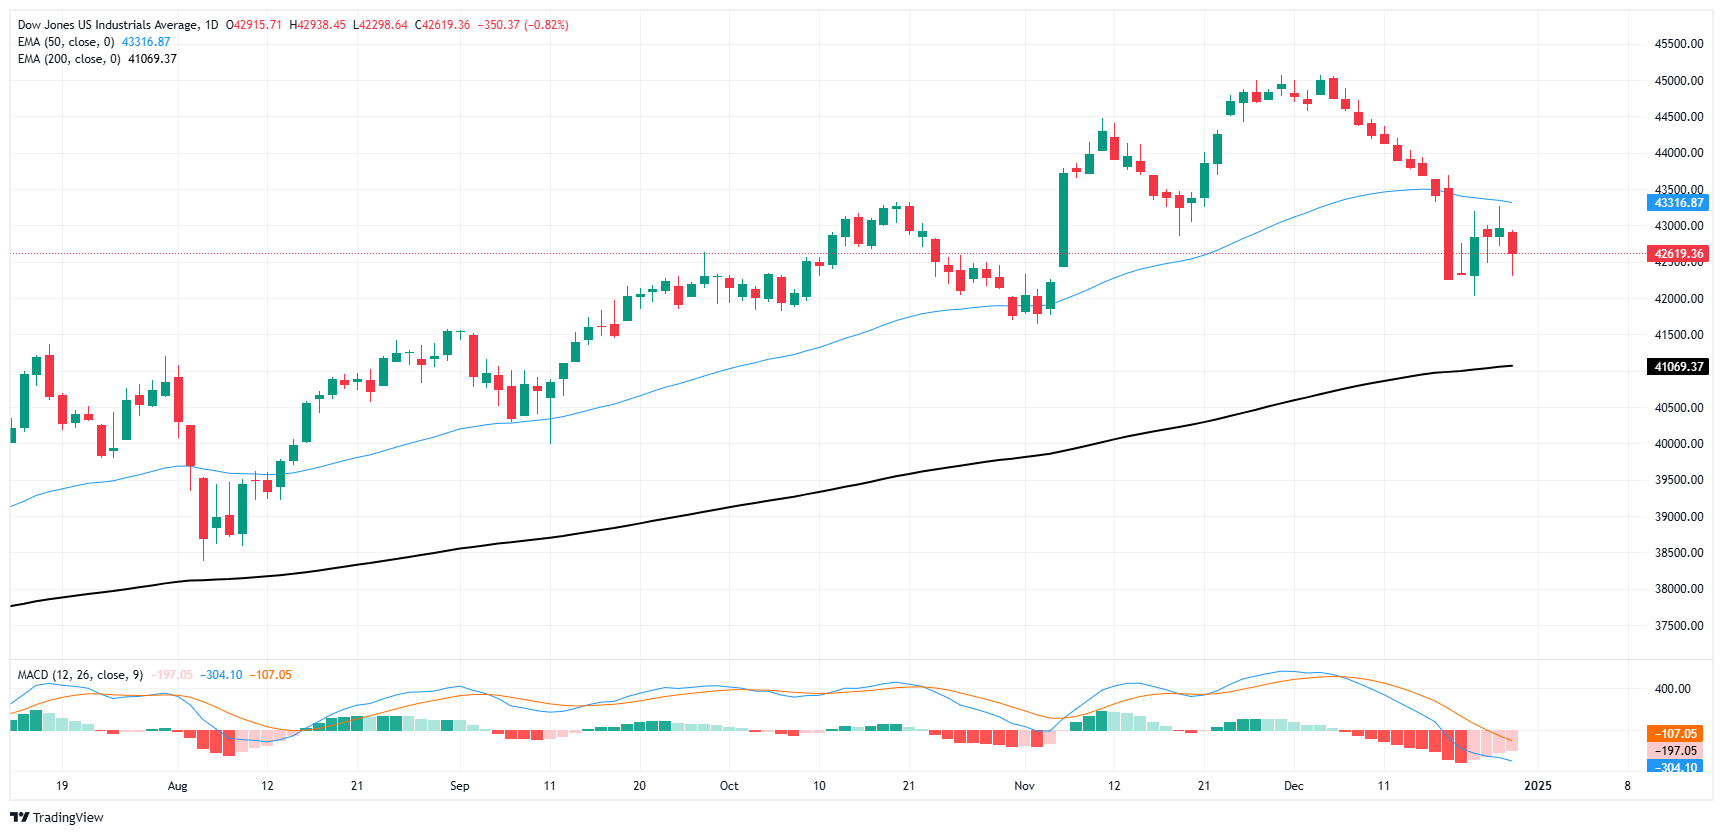
The Dow Jones’ recent plunge from all-time peaks has left near-term price action battling the charts below the 50-day Exponential Moving Average (EMA), a moving average that has provided technical support for bids through the last 13 straight months. Prices are still holding north of the 42,000 key handle, but bullish momentum remains limited as bids remain caught below the last swing low into 43,000.
Dow Jones daily chart
Fed FAQs
Monetary policy in the US is shaped by the Federal Reserve (Fed). The Fed has two mandates: to achieve price stability and foster full employment. Its primary tool to achieve these goals is by adjusting interest rates. When prices are rising too quickly and inflation is above the Fed’s 2% target, it raises interest rates, increasing borrowing costs throughout the economy. This results in a stronger US Dollar (USD) as it makes the US a more attractive place for international investors to park their money. When inflation falls below 2% or the Unemployment Rate is too high, the Fed may lower interest rates to encourage borrowing, which weighs on the Greenback.
The Federal Reserve (Fed) holds eight policy meetings a year, where the Federal Open Market Committee (FOMC) assesses economic conditions and makes monetary policy decisions. The FOMC is attended by twelve Fed officials – the seven members of the Board of Governors, the president of the Federal Reserve Bank of New York, and four of the remaining eleven regional Reserve Bank presidents, who serve one-year terms on a rotating basis.
In extreme situations, the Federal Reserve may resort to a policy named Quantitative Easing (QE). QE is the process by which the Fed substantially increases the flow of credit in a stuck financial system. It is a non-standard policy measure used during crises or when inflation is extremely low. It was the Fed’s weapon of choice during the Great Financial Crisis in 2008. It involves the Fed printing more Dollars and using them to buy high grade bonds from financial institutions. QE usually weakens the US Dollar.
Quantitative tightening (QT) is the reverse process of QE, whereby the Federal Reserve stops buying bonds from financial institutions and does not reinvest the principal from the bonds it holds maturing, to purchase new bonds. It is usually positive for the value of the US Dollar.
Author

Joshua Gibson
FXStreet
Joshua joins the FXStreet team as an Economics and Finance double major from Vancouver Island University with twelve years' experience as an independent trader focusing on technical analysis.


