- Dow Jones plummeted over 900 points top-to-bottom on Friday.
- US NFP jobs data came in well below forecasts, worst initial print since 2019.
- Souring US economic data sends investors piling into rate cut bets.
The Dow Jones Industrial Average (DJIA) plummeted over 900 points peak-to-trough on Friday after the monthly US Nonfarm Payrolls (NFP) printed its lowest initial figure since May of 2019. Steep revisions to previous figures further depressed the market’s outlook on the US employment landscape, and a rising US unemployment rate has sent investors scrambling to bet on an accelerated pace of rate cuts from the Federal Reserve (Fed).
Friday’s US NFP labor data dump showed the US added 114K net new jobs in July, well below the forecast 175K and the previous month’s figure was revised to 179K from the initial print of 206K. The US Unemployment Rate also ticked higher to 4.3%, the highest reading since November of 2021, while the U6 Underemployment Rate rose to 7.8% from 7.4% as employed people struggle to find jobs that provide enough hours.
Average Hourly Earnings growth also eased to 0.2% MoM from the expected hold at 0.3%, with YoY wages growth cooling to 3.6% from the previous 3.8%.
With US economic data turning broadly sour, investors extended a two-day decline on growing fears of a broad recession within the domestic US economy, sparking a flight out of risk assets and sending equity indexes broadly lower. According to the CME’s FedWatch Tool, rate traders have fully priced in a rate cut in September, with 70% odds of a double-cut for 50 basis points when the Fed gives its rate call on September 18.
Economic Indicator
Nonfarm Payrolls
The Nonfarm Payrolls release presents the number of new jobs created in the US during the previous month in all non-agricultural businesses; it is released by the US Bureau of Labor Statistics (BLS). The monthly changes in payrolls can be extremely volatile. The number is also subject to strong reviews, which can also trigger volatility in the Forex board. Generally speaking, a high reading is seen as bullish for the US Dollar (USD), while a low reading is seen as bearish, although previous months' reviews and the Unemployment Rate are as relevant as the headline figure. The market's reaction, therefore, depends on how the market assesses all the data contained in the BLS report as a whole.
Read more.Last release: Fri Aug 02, 2024 12:30
Frequency: Monthly
Actual: 114K
Consensus: 175K
Previous: 206K
Source: US Bureau of Labor Statistics
America’s monthly jobs report is considered the most important economic indicator for forex traders. Released on the first Friday following the reported month, the change in the number of positions is closely correlated with the overall performance of the economy and is monitored by policymakers. Full employment is one of the Federal Reserve’s mandates and it considers developments in the labor market when setting its policies, thus impacting currencies. Despite several leading indicators shaping estimates, Nonfarm Payrolls tend to surprise markets and trigger substantial volatility. Actual figures beating the consensus tend to be USD bullish.
Dow Jones news
Two-thirds of the Dow Jones was in the red on Friday, with slim gains getting entirely swamped out by steep losses in key tech stocks. Intel Inc. (INTC) plummeted 26% on Friday, tumbling below $21.50 per share after the major software company announced quarterly revenue that missed guidance, earning $12.83 billion in the second quarter, down 1% from the same time last year and missing the analyst forecast of $12.94 billion. Intel also revised their current-quarter revenue forecast to between $12.5 billion and $13.5 billion, less than the analyst expectation of $14.35 billion. In a bid to appeal to the markets, Intel announced plans to lay off 15% of their workforce in the coming months in order to trim labor costs.
Dow Jones technical outlook
Dow Jones plummeted into a second day of losses, falling over 900 points at Friday’s absolute bottom and slipping below the 40,000.00 major price handle. DJIA is struggling to find the brakes as bids fall below the 50-day Exponential Moving Average (EMA) at 39,683.02, and bulls will be looking to restore balance before price action can extend a decline back to the 200-day EMA at 37,982.00.
Dow Jones five minute chart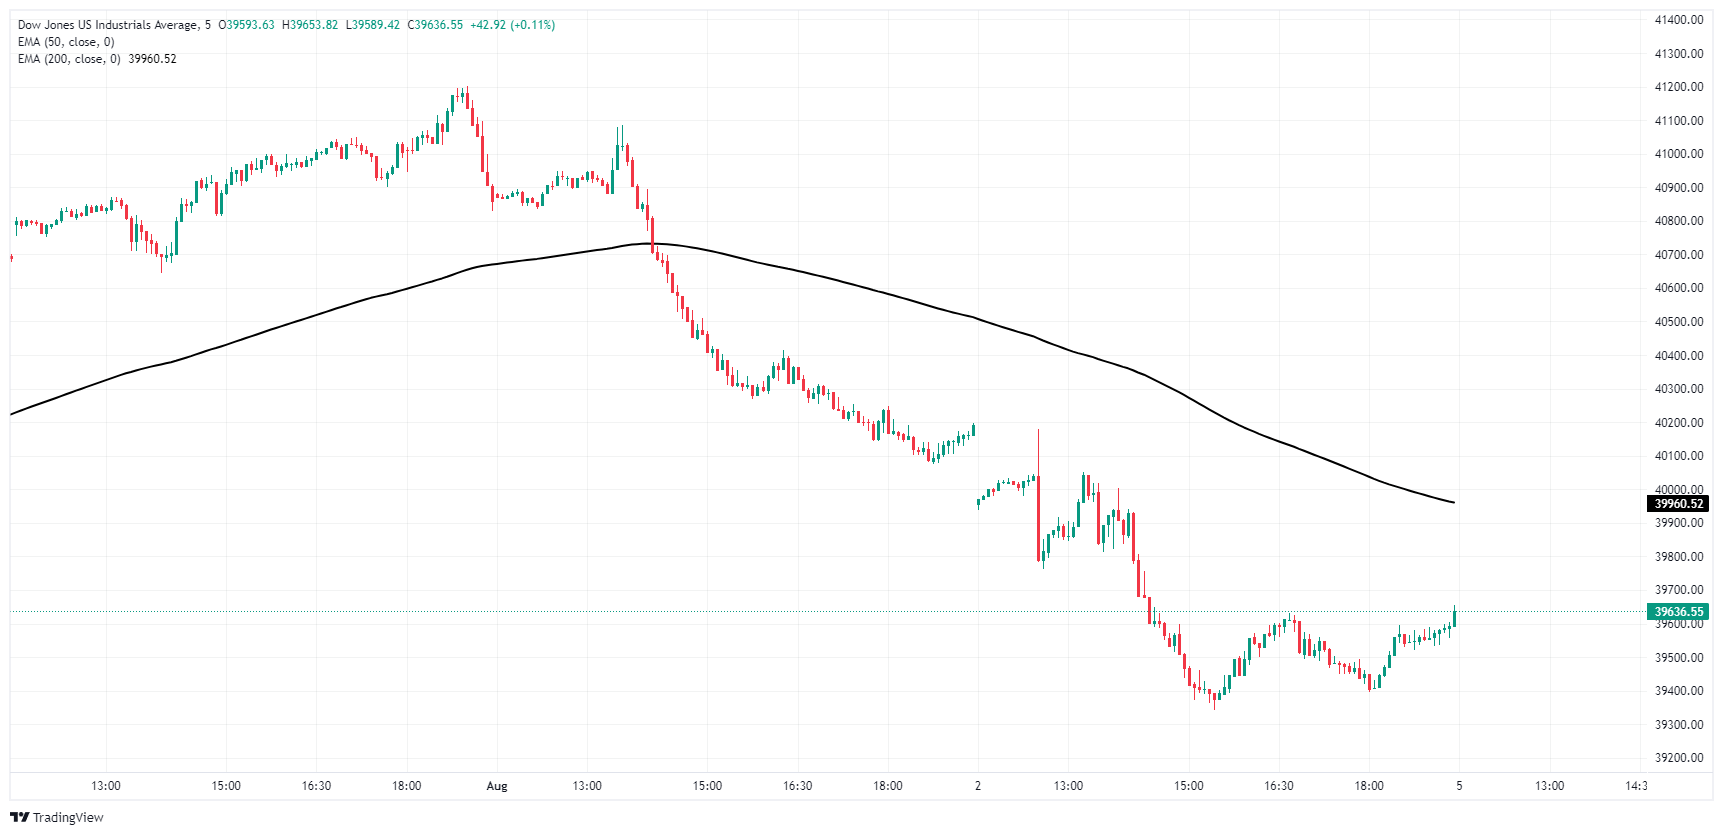
Dow Jones daily chart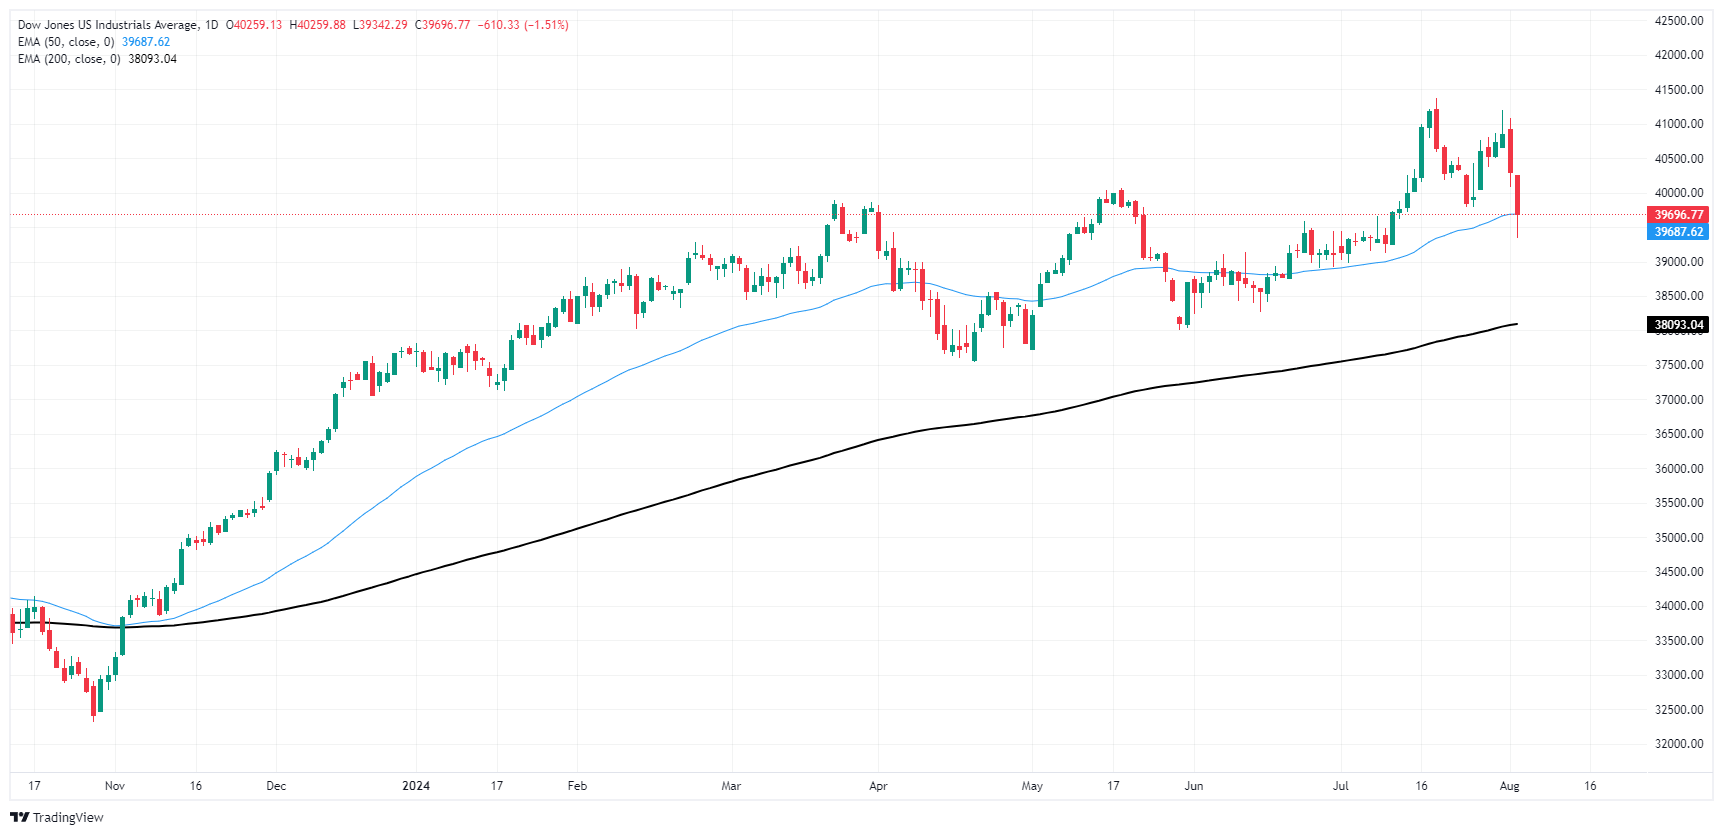
Dow Jones FAQs
The Dow Jones Industrial Average, one of the oldest stock market indices in the world, is compiled of the 30 most traded stocks in the US. The index is price-weighted rather than weighted by capitalization. It is calculated by summing the prices of the constituent stocks and dividing them by a factor, currently 0.152. The index was founded by Charles Dow, who also founded the Wall Street Journal. In later years it has been criticized for not being broadly representative enough because it only tracks 30 conglomerates, unlike broader indices such as the S&P 500.
Many different factors drive the Dow Jones Industrial Average (DJIA). The aggregate performance of the component companies revealed in quarterly company earnings reports is the main one. US and global macroeconomic data also contributes as it impacts on investor sentiment. The level of interest rates, set by the Federal Reserve (Fed), also influences the DJIA as it affects the cost of credit, on which many corporations are heavily reliant. Therefore, inflation can be a major driver as well as other metrics which impact the Fed decisions.
Dow Theory is a method for identifying the primary trend of the stock market developed by Charles Dow. A key step is to compare the direction of the Dow Jones Industrial Average (DJIA) and the Dow Jones Transportation Average (DJTA) and only follow trends where both are moving in the same direction. Volume is a confirmatory criteria. The theory uses elements of peak and trough analysis. Dow’s theory posits three trend phases: accumulation, when smart money starts buying or selling; public participation, when the wider public joins in; and distribution, when the smart money exits.
There are a number of ways to trade the DJIA. One is to use ETFs which allow investors to trade the DJIA as a single security, rather than having to buy shares in all 30 constituent companies. A leading example is the SPDR Dow Jones Industrial Average ETF (DIA). DJIA futures contracts enable traders to speculate on the future value of the index and Options provide the right, but not the obligation, to buy or sell the index at a predetermined price in the future. Mutual funds enable investors to buy a share of a diversified portfolio of DJIA stocks thus providing exposure to the overall index.
Information on these pages contains forward-looking statements that involve risks and uncertainties. Markets and instruments profiled on this page are for informational purposes only and should not in any way come across as a recommendation to buy or sell in these assets. You should do your own thorough research before making any investment decisions. FXStreet does not in any way guarantee that this information is free from mistakes, errors, or material misstatements. It also does not guarantee that this information is of a timely nature. Investing in Open Markets involves a great deal of risk, including the loss of all or a portion of your investment, as well as emotional distress. All risks, losses and costs associated with investing, including total loss of principal, are your responsibility. The views and opinions expressed in this article are those of the authors and do not necessarily reflect the official policy or position of FXStreet nor its advertisers. The author will not be held responsible for information that is found at the end of links posted on this page.
If not otherwise explicitly mentioned in the body of the article, at the time of writing, the author has no position in any stock mentioned in this article and no business relationship with any company mentioned. The author has not received compensation for writing this article, other than from FXStreet.
FXStreet and the author do not provide personalized recommendations. The author makes no representations as to the accuracy, completeness, or suitability of this information. FXStreet and the author will not be liable for any errors, omissions or any losses, injuries or damages arising from this information and its display or use. Errors and omissions excepted.
The author and FXStreet are not registered investment advisors and nothing in this article is intended to be investment advice.
Recommended content
Editors’ Picks

EUR/USD stabilizes around 1.2550 after hitting two-year lows
EUR/USD plunged to 1.0223, its lowest in over two years, as risk aversion fueled demand for the US Dollar. Thin post-holiday trading exacerbated the movements, with financial markets slowly returning to normal.

USD/JPY flirts with multi-month highs in the 158.00 region
The USD/JPY pair traded as high as 157.84 on Thursday, nearing the December multi-month high of 158.07. Additional gains are on the docket amid prevalent risk aversion.

Gold retains the $2,650 level as Asian traders reach their desks
Gold gathered recovery momentum and hit a two-week-high at $2,660 in the American session on Thursday. The precious metal benefits from the sour market mood and looks poised to extend its advance ahead of the weekly close.

These 5 altcoins are rallying ahead of $16 billion FTX creditor payout
FTX begins creditor payouts on January 3, in agreement with BitGo and Kraken, per an official announcement. Bonk, Fantom, Jupiter, Raydium and Solana are rallying on Thursday, before FTX repayment begins.

Three Fundamentals: Year-end flows, Jobless Claims and ISM Manufacturing PMI stand out Premium
Money managers may adjust their portfolios ahead of the year-end. Weekly US Jobless Claims serve as the first meaningful release in 2025. The ISM Manufacturing PMI provides an initial indication ahead of Nonfarm Payrolls.

Best Forex Brokers with Low Spreads
VERIFIED Low spreads are crucial for reducing trading costs. Explore top Forex brokers offering competitive spreads and high leverage. Compare options for EUR/USD, GBP/USD, USD/JPY, and Gold.