Dow Jones Industrial Average heads lower as tariff fears loom
- The Dow Jones backslid another 100 points on Thursday.
- Equities are facing further downside as US tariffs weigh on car manufacturing.
- Financial agencies are stepping up their warnings of risks to the US economy.

The Dow Jones Industrial Average (DJIA) headed lower for a second straight day on Thursday, declining another 100 points to fall one-quarter of one percent. The major equity index is testing below 42,400 as investors grapple with a fresh bout of tariff threats from the Trump administration.
United States (US) President Donald Trump has slated a 25% tariff to be imposed on all vehicles imported into the US, to begin on April 2 in tandem with a wide-reaching package of “reciprocal” tariffs across the board. Standard & Poors Global (S&P Global), Fitch Ratings, Moody’s, and the Congressional Budget Office (CBO) all took the opportunity to highlight risk clouds that are beginning to gather over the US economy as the Trump administration pursues an us-vs-everybody trade standoff with all of the US’s trading partners at the same time.
US Gross Domestic Product (GDP) figures for 2024’s fourth quarter came in slightly higher than expected, with the US economy growing by 2.4% on an annualized basis, slightly beating median market forecasts of 2.3%. However any celebrations about US growth were quickly hobbled by the Moody’s ratings agency, who followed up economic warnings earlier this week with a fresh klaxon that higher tariffs and tax cuts will dramatically boost government deficits. According to Moody’s, the financial agency is moving closer to downgrading the quality of US debt, a move that would likely spark a rise in Treasury yields, making US debt even more expensive.
S&P Global warned that US policy uncertainty will hamper global growth outlook, as well as economic prospects across the board. Fitch Ratings noted that US tariffs, if implemented as they currently stand, will have a devastating impact on smaller economies including Brazil, India, and Vietnam, which will make it harder, not easier, for emerging market (EM) economies pivot into being a net purchaser of US goods and services like President Trump wants.
CBO slashed its own US growth forecasts on Thursday, shifting its 2025 GDP forecast to just 1.9%, an annual growth figure the government office doesn’t expect the US to overcome for the foreseeable future, all the way out to 2035, where they see US growth slowing even further. CBO also expects the rate of inflation slowing within the US economy to functionally grind to a halt in 2025. CBO, in line with recent Federal Reserve (Fed) forecasts, now expects the current pace of inflation to remain stubbornly high until some point in 2027.
The CBO also expects US the US budget deficit to soar to 7.3% of GDP in 2025 unless federal agencies make changes to their current plans. According to CBO calculations, US debt servicing including interest payments are expected to take up 5.4% of annual US GDP by 2055 unless changes are made.
Stock news
Equity indexes are facing downside pressure on Thursday, however losses remain limited vehicle manufacturers exposed to planned Trump administration tariffs on all foreign-produced vehicles. According to rough estimates, nearly 40% of every single vehicle on US roads is manufactured or produced by foreign companies. As investors dig in their heels and hope for good signs soon. The Dow Jones is down roughly one-quarter of one percent, with the S&P 500 and Nasdaq Composite both trading trading down between one-half and one-third of one percent from the day’s opening bids.
Read more stock news: Nvidia drops below $111 despite product lead on AMD
Dow Jones price forecast
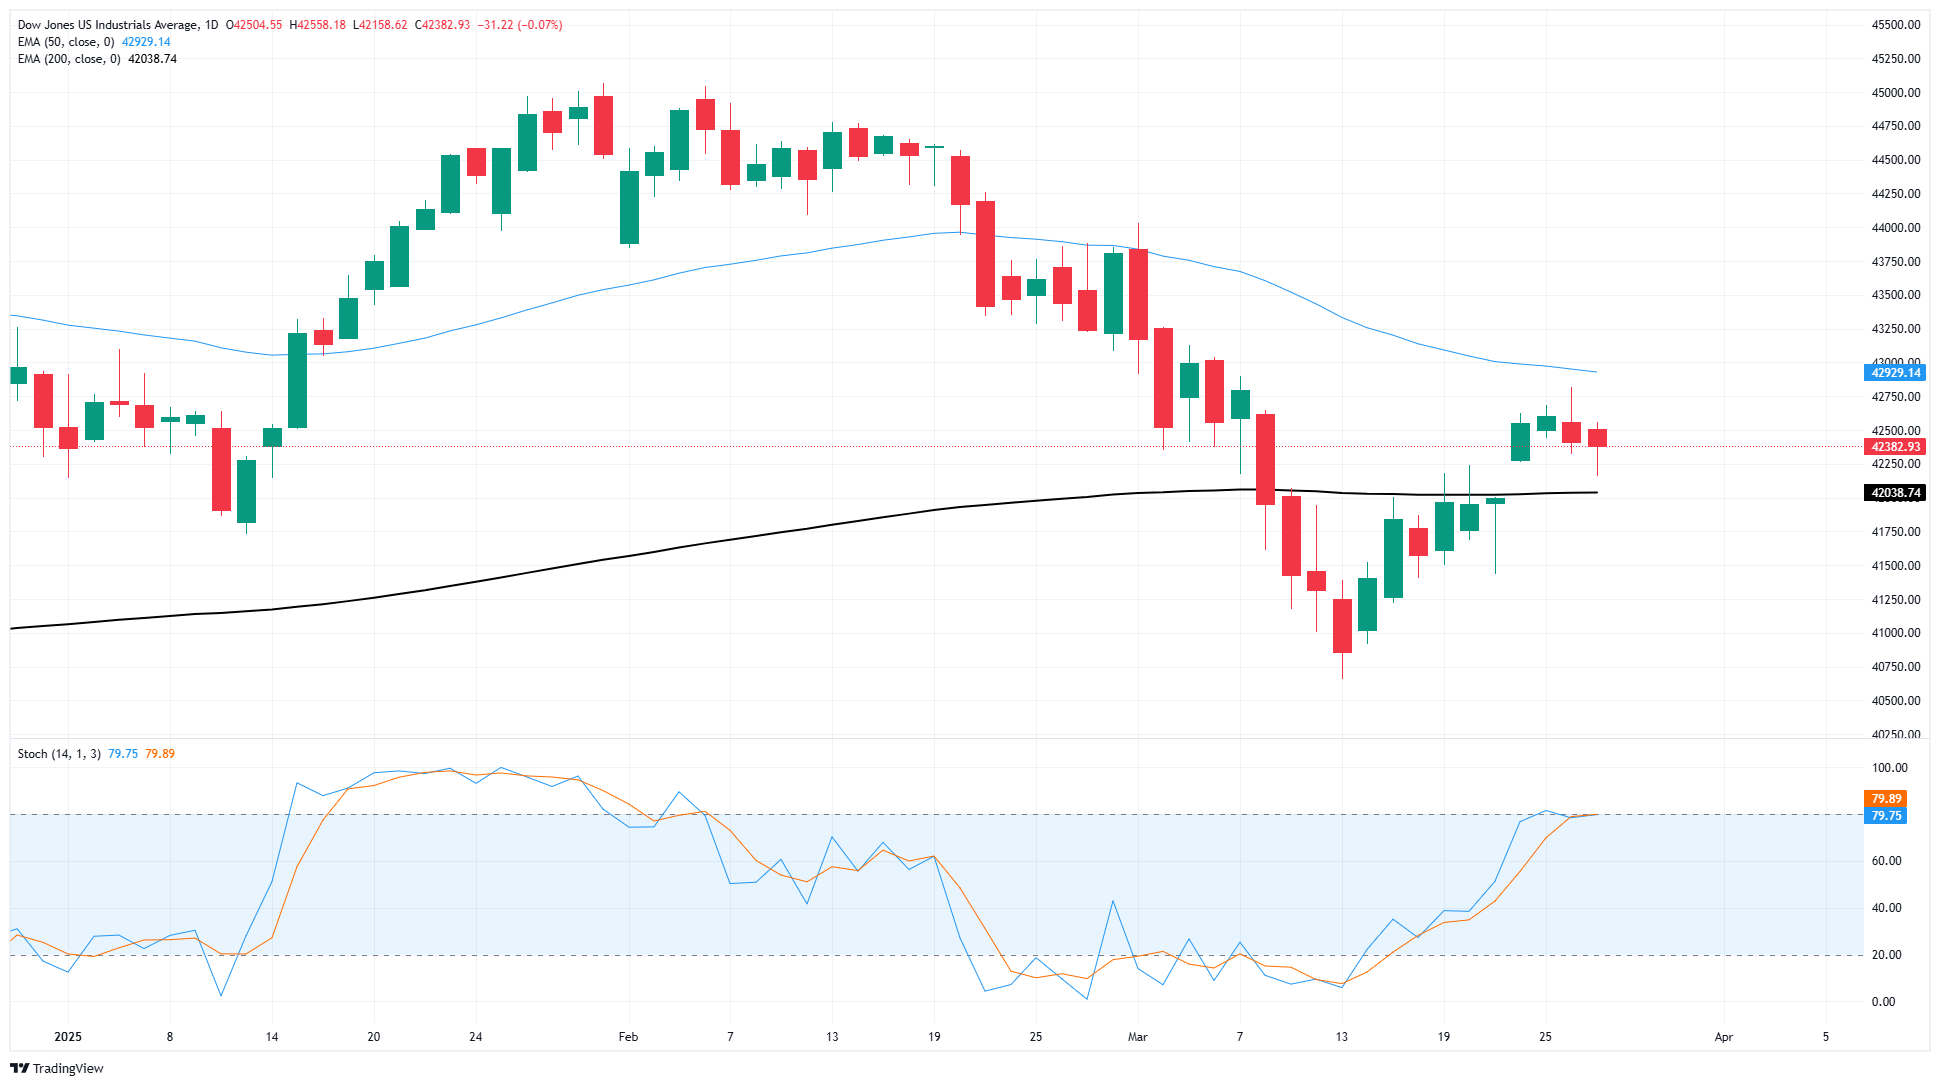
The Dow Jones continues to test back into the 200-day Exponential Moving Average (EMA) near 42,000 as long-term bullish momentum bleeds out of the charts. Bidding action remains capped by the 50-day EMA just below the 43,000 price handle, and the Dow Jones’ recent bullish recovery appears to be over and geared to price in its first lower-high pattern in almost two years.
Dow Jones daily chart
S&P 500 FAQs
The S&P 500 is a widely followed stock price index which measures the performance of 500 publicly owned companies, and is seen as a broad measure of the US stock market. Each company’s influence on the computation of the index is weighted based on market capitalization. This is calculated by multiplying the number of publicly traded shares of the company by the share price. The S&P 500 index has achieved impressive returns – $1.00 invested in 1970 would have yielded a return of almost $192.00 in 2022. The average annual return since its inception in 1957 has been 11.9%.
Companies are selected by committee, unlike some other indexes where they are included based on set rules. Still, they must meet certain eligibility criteria, the most important of which is market capitalization, which must be greater than or equal to $12.7 billion. Other criteria include liquidity, domicile, public float, sector, financial viability, length of time publicly traded, and representation of the industries in the economy of the United States. The nine largest companies in the index account for 27.8% of the market capitalization of the index.
There are a number of ways to trade the S&P 500. Most retail brokers and spread betting platforms allow traders to use Contracts for Difference (CFD) to place bets on the direction of the price. In addition, that can buy into Index, Mutual and Exchange Traded Funds (ETF) that track the price of the S&P 500. The most liquid of the ETFs is State Street Corporation’s SPY. The Chicago Mercantile Exchange (CME) offers futures contracts in the index and the Chicago Board of Options (CMOE) offers options as well as ETFs, inverse ETFs and leveraged ETFs.
Many different factors drive the S&P 500 but mainly it is the aggregate performance of the component companies revealed in their quarterly and annual company earnings reports. US and global macroeconomic data also contributes as it impacts on investor sentiment, which if positive drives gains. The level of interest rates, set by the Federal Reserve (Fed), also influences the S&P 500 as it affects the cost of credit, on which many corporations are heavily reliant. Therefore, inflation can be a major driver as well as other metrics which impact the Fed decisions.
Author

Joshua Gibson
FXStreet
Joshua joins the FXStreet team as an Economics and Finance double major from Vancouver Island University with twelve years' experience as an independent trader focusing on technical analysis.


