Dow Jones Industrial Average rebounds as investors brace for key US data and earnings reports
- Dow Jones gains 350 points, recovering from last week’s loss, as investors anticipate GDP, Nonfarm Payrolls and PCE Price Index releases.
- Treasury yields climb with the 10-year note yield nearing 4.30%, amid speculation that the Fed could remain less dovish than anticipated.
- Strong performers include 3M (MMM), Goldman Sachs (GS) and McDonald’s (MCD), while Boeing (BA) and Cisco (CSCO) lag in the index.

The Dow Jones Industrial Average (DJIA) has recovered from Friday’s 300-point loss, climbing over 0.84% or 350 points even though US Treasury bond yields continued to rise. Investors are capitalizing ahead of the release of crucial economic data from the United States (US) that will feature the release of Gross Domestic Product (GDP) figures, Nonfarm Payrolls (NFP), and the Federal Reserve’s (Fed) favorite inflation gauge — the Personal Consumption Price Expenditures (PCE) Price Index.
The US 10-year Treasury note yield approaches 4.30%, up by over three-and-a-half basis points, amid speculation that the Fed could turn less dovish than expected. Investors eye the release of earnings reports on five of the “Magnificent Seven” mega caps as Alphabet (GOOG), Apple (AAPL), Amazon (AMZN), Microsoft (MSFT), and Meta (META) could rock the boat and increase volatility in the DJIA.
Apple (AAPL) revealed its latest Apple AI system, which is available as an update to some products compatible with certain iPhones, iPads and Macs. On Tuesday, Alphabet (GOOG) is expected to unveil earnings after the closing, followed by Meta (META) and Microsoft (MSFT) on Wednesday.
Dow Jones news
Twenty-two of the 30 companies listed on the DJIA are posting gains, led by 3M (MMM), up 4.50% at $130.36 per share. Goldman Sachs (GS) gained 1.92% to $522.44, and McDonald’s (MCD) gained 1.76% to $297.75 at the time of writing.
At the bottom of the pack lies Boeing (BA), which plunged 1.69% to $152.40. Cisco Systems (CSCO) lost 0.74% to $55.33, and International Business Machines (IBM) edged 0.71% lower to $213.15.
Dow Jones price forecast
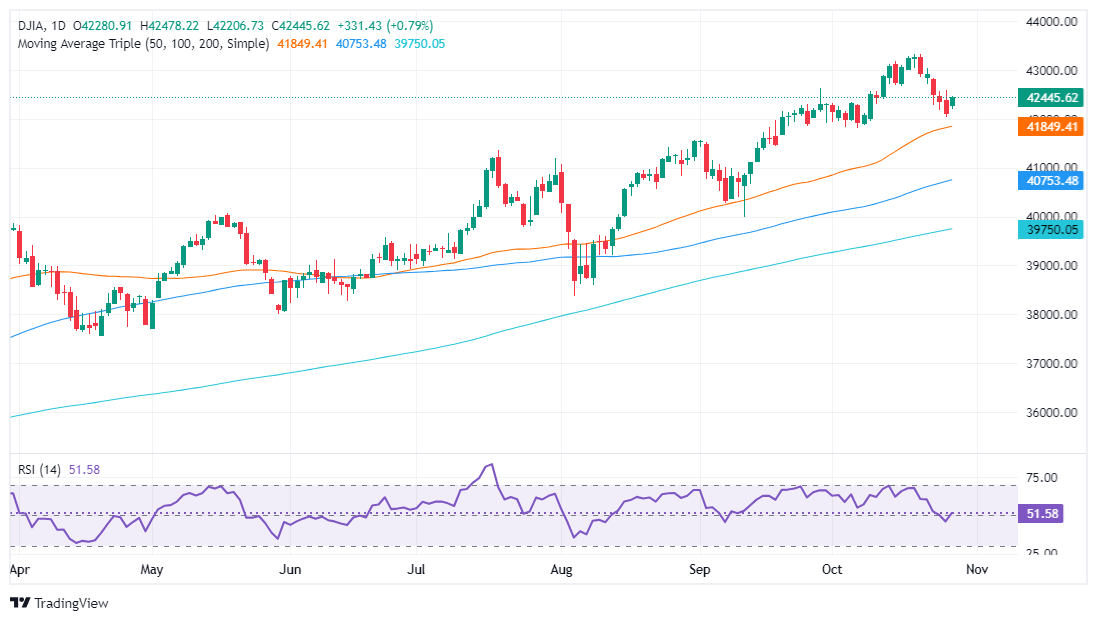
The Dow Jones remains contained within Friday’s price action, forming an “inside day”, which has bullish implications. If the DJIA clears the October 25 peak at 42,596, the next stop would be 43,000. If surpassed, nothing would be in the bulls’ path to challenge the record high at 43,322.
Conversely, for a bearish scenario, the index should drop below last week’s bottom of 42,043, so sellers could push the Dow Jones toward the 50-day Simple Moving Average (SMA) at 41,848.
Momentum remains bullish as depicted by the Relative Strength Index (RSI), which just pierced above its neutral line. This hints that buyers bought the dip and are eyeing higher levels.
Dow Jones daily chart
Dow Jones FAQs
The Dow Jones Industrial Average, one of the oldest stock market indices in the world, is compiled of the 30 most traded stocks in the US. The index is price-weighted rather than weighted by capitalization. It is calculated by summing the prices of the constituent stocks and dividing them by a factor, currently 0.152. The index was founded by Charles Dow, who also founded the Wall Street Journal. In later years it has been criticized for not being broadly representative enough because it only tracks 30 conglomerates, unlike broader indices such as the S&P 500.
Many different factors drive the Dow Jones Industrial Average (DJIA). The aggregate performance of the component companies revealed in quarterly company earnings reports is the main one. US and global macroeconomic data also contributes as it impacts on investor sentiment. The level of interest rates, set by the Federal Reserve (Fed), also influences the DJIA as it affects the cost of credit, on which many corporations are heavily reliant. Therefore, inflation can be a major driver as well as other metrics which impact the Fed decisions.
Dow Theory is a method for identifying the primary trend of the stock market developed by Charles Dow. A key step is to compare the direction of the Dow Jones Industrial Average (DJIA) and the Dow Jones Transportation Average (DJTA) and only follow trends where both are moving in the same direction. Volume is a confirmatory criteria. The theory uses elements of peak and trough analysis. Dow’s theory posits three trend phases: accumulation, when smart money starts buying or selling; public participation, when the wider public joins in; and distribution, when the smart money exits.
There are a number of ways to trade the DJIA. One is to use ETFs which allow investors to trade the DJIA as a single security, rather than having to buy shares in all 30 constituent companies. A leading example is the SPDR Dow Jones Industrial Average ETF (DIA). DJIA futures contracts enable traders to speculate on the future value of the index and Options provide the right, but not the obligation, to buy or sell the index at a predetermined price in the future. Mutual funds enable investors to buy a share of a diversified portfolio of DJIA stocks thus providing exposure to the overall index.
Author

Christian Borjon Valencia
FXStreet
Markets analyst, news editor, and trading instructor with over 14 years of experience across FX, commodities, US equity indices, and global macro markets.


