- The Dow Jones got dragged into the depths on Friday, plummeting nearly 2,000 points.
- It’s the single worst day for equities since the pandemic selloff as the US kicks off a global trade war.
- China has announced its own retaliatory tariffs on the US, causing markets to brush off NFP.
The Dow Jones Industrial Average (DJIA) had one of its worst trading days since the pandemic period, shedding over 2,000 points to fall over 5% on the day and putting the major equity index on pace for one of its worst-ever trading days in absolute points terms. Global markets are roiling as the Trump administration gets its wish of a global trade war that pits the US against everybody else at the same time.
The Dow Jones fell to 38,500 on Friday, hitting its lowest levels in 10 months, and is down nearly 18% from record highs posted last November. The Standard & Poor’s 500 (S&P) megacap index is down over 300 points, falling over 5.5%. The Nasdaq Composite index also declined around 1,000 points, declining a matching 5.5% as equities across the board get pummeled by broad-market risk aversion.
Read more stock news: Nike stock spikes 5% after Vietnamese leader signals willingness to negotiate
China has announced its own retaliatory tariffs against the US’s “reciprocal” tariffs that were announced this week, which were ‘calculated’ by passing net imports and exports through a formula that has caught much derision across social media and economic circles. The Trump administration imposed a 34% tariff on China this week, sparking a retaliatory 34% tariff from China, sending global markets into a tailspin and kicking off another leg down in the tariff spiral.
US Nonfarm Payrolls (NFP) came in much stronger than expected, doing next to nothing to slow the pace of broad-market selling pressure. The US added 228K net new jobs in March, nearly double February’s revised print of 117K, which was sharply adjusted lower from 151K. US Average Hourly Earnings fell faster than expected to 3.8% YoY, dropping from the previous period’s 4.0%. The US Unemployment Rate also ticked higher to 4.2% versus the expected hold at 4.1%.
Despite the overall upside print in NFP net job gains, labor figures are beginning to show signs of weakness, cracks are beginning to appear in the US labor market. Coupled with impending economic weakness at the hands of the Trump team’s global tariffs, markets are pinning their bets on at least 100 bps in rate cuts from the Federal Reserve (Fed) by the end of the year. However, this bet is quickly coming to loggerheads with direct communication from Fed officials, who have significantly stepped up their calls for caution on policy changes in the face of the Trump administration’s aspirations of funding the US deficit entirely with trade taxes on US consumers.
Dow Jones price forecast
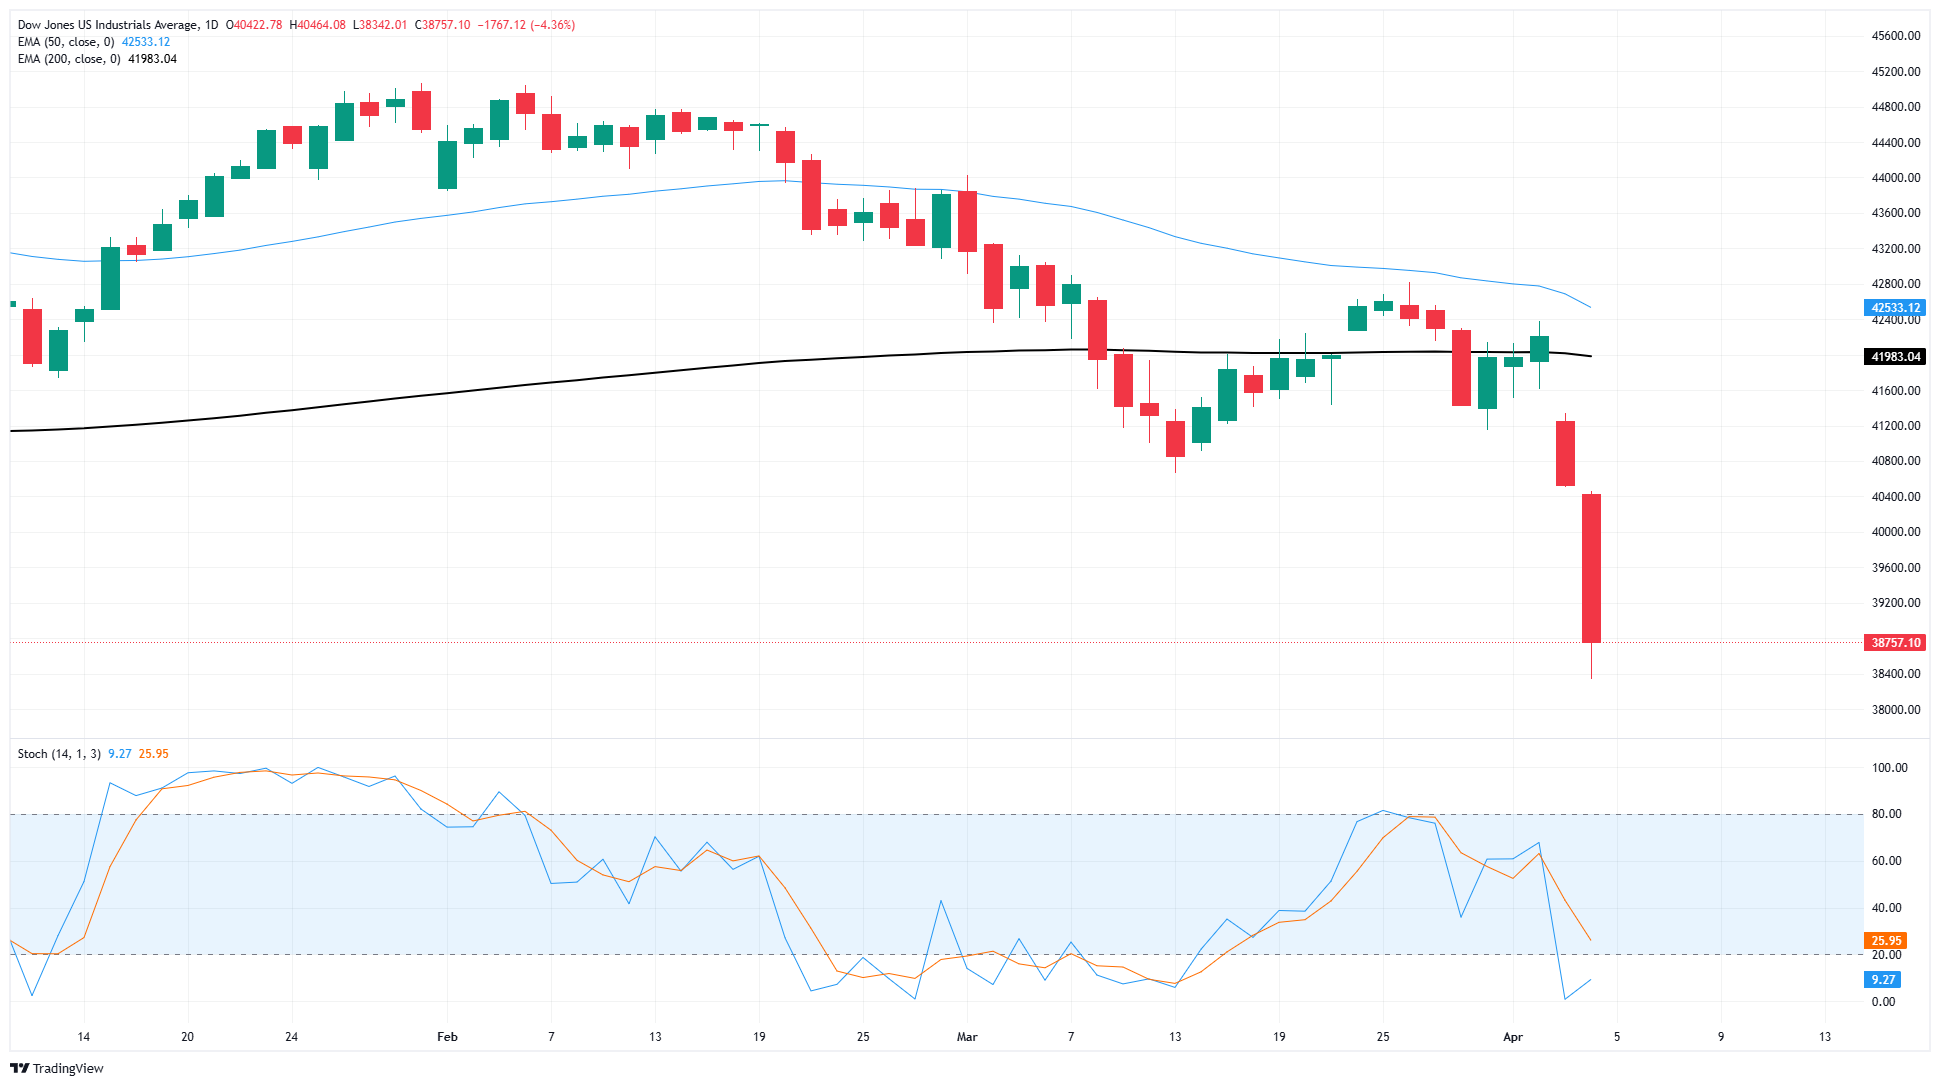
It’s a bad day to be an equity index. The Dow Jones has plummeted to ten-month lows, entirely erasing nearly a year’s worth gains and putting the major stock index well below the 40,000 major price handle. The Dow Jones is down 15% from the year’s peaks just above 45,000, and poised for further losses as the DJIA enters freefall well below the 200-day Exponential Moving Average (EMA) at 42,000.
Dow Jones daily chart
Dow Jones FAQs
The Dow Jones Industrial Average, one of the oldest stock market indices in the world, is compiled of the 30 most traded stocks in the US. The index is price-weighted rather than weighted by capitalization. It is calculated by summing the prices of the constituent stocks and dividing them by a factor, currently 0.152. The index was founded by Charles Dow, who also founded the Wall Street Journal. In later years it has been criticized for not being broadly representative enough because it only tracks 30 conglomerates, unlike broader indices such as the S&P 500.
Many different factors drive the Dow Jones Industrial Average (DJIA). The aggregate performance of the component companies revealed in quarterly company earnings reports is the main one. US and global macroeconomic data also contributes as it impacts on investor sentiment. The level of interest rates, set by the Federal Reserve (Fed), also influences the DJIA as it affects the cost of credit, on which many corporations are heavily reliant. Therefore, inflation can be a major driver as well as other metrics which impact the Fed decisions.
Dow Theory is a method for identifying the primary trend of the stock market developed by Charles Dow. A key step is to compare the direction of the Dow Jones Industrial Average (DJIA) and the Dow Jones Transportation Average (DJTA) and only follow trends where both are moving in the same direction. Volume is a confirmatory criteria. The theory uses elements of peak and trough analysis. Dow’s theory posits three trend phases: accumulation, when smart money starts buying or selling; public participation, when the wider public joins in; and distribution, when the smart money exits.
There are a number of ways to trade the DJIA. One is to use ETFs which allow investors to trade the DJIA as a single security, rather than having to buy shares in all 30 constituent companies. A leading example is the SPDR Dow Jones Industrial Average ETF (DIA). DJIA futures contracts enable traders to speculate on the future value of the index and Options provide the right, but not the obligation, to buy or sell the index at a predetermined price in the future. Mutual funds enable investors to buy a share of a diversified portfolio of DJIA stocks thus providing exposure to the overall index.
Information on these pages contains forward-looking statements that involve risks and uncertainties. Markets and instruments profiled on this page are for informational purposes only and should not in any way come across as a recommendation to buy or sell in these assets. You should do your own thorough research before making any investment decisions. FXStreet does not in any way guarantee that this information is free from mistakes, errors, or material misstatements. It also does not guarantee that this information is of a timely nature. Investing in Open Markets involves a great deal of risk, including the loss of all or a portion of your investment, as well as emotional distress. All risks, losses and costs associated with investing, including total loss of principal, are your responsibility. The views and opinions expressed in this article are those of the authors and do not necessarily reflect the official policy or position of FXStreet nor its advertisers. The author will not be held responsible for information that is found at the end of links posted on this page.
If not otherwise explicitly mentioned in the body of the article, at the time of writing, the author has no position in any stock mentioned in this article and no business relationship with any company mentioned. The author has not received compensation for writing this article, other than from FXStreet.
FXStreet and the author do not provide personalized recommendations. The author makes no representations as to the accuracy, completeness, or suitability of this information. FXStreet and the author will not be liable for any errors, omissions or any losses, injuries or damages arising from this information and its display or use. Errors and omissions excepted.
The author and FXStreet are not registered investment advisors and nothing in this article is intended to be investment advice.


Recommended content
Editors’ Picks

ECB reduces rates by 25 bps as largely expected – LIVE
On Thursday, the ECB delivered the 25 bps cut everyone expected, trimming the Deposit Facility Rate to 2.25%. EUR/USD remained within its daily sideline theme around the 1.1350-1.1360 band in the wake of the release. Now, all eyes are on Christine Lagarde’s live press conference as investors hang on her every word for clues about what comes next.

GBP/USD trades in an inconclusive fashion around 1.3230
GBP/USD is stuck in the 1.3250–1.3260 corridor on Thursday, maintaining a rangebound mood in response to the acceptable bounce in the Greenback and the generalised offered bias in the broad risk-linked galaxy.

Gold remains affered, recedes to the $3,340 area post-ECB
Gold powered to a fresh record, flirting with the $3,360 area per troy ounce, before embarking on a correction to the current $3,340 zone, always on the back of the decent rebound in the US Dollar and the recovery in US Treasury yields across the curve.

Crypto market cap fell more than 18% in Q1, wiping out $633.5 billion after Trump’s inauguration top
CoinGecko’s Q1 Crypto Industry Report highlights that the total crypto market capitalization fell by 18.6% in the first quarter, wiping out $633.5 billion after topping on January 18, just a couple of days ahead of US President Donald Trump’s inauguration.

Future-proofing portfolios: A playbook for tariff and recession risks
It does seem like we will be talking tariffs for a while. And if tariffs stay — in some shape or form — even after negotiations, we’ll likely be talking about recession too. Higher input costs, persistent inflation, and tighter monetary policy are already weighing on global growth.

The Best brokers to trade EUR/USD
SPONSORED Discover the top brokers for trading EUR/USD in 2025. Our list features brokers with competitive spreads, fast execution, and powerful platforms. Whether you're a beginner or an expert, find the right partner to navigate the dynamic Forex market.