Dow Jones Industrial Average tests the high side as investors try to respark the tech run
- The Dow Jones clambered back over the 43,000 level on Monday.
- Market sentiment rose after a report that the Trump team might trim tariff plans.
- Final US S&P Global PMIs missed Wall Street forecasts in December but still rose.
The Dow Jones Industrial Average (DJIA) extended into the bullish side to kick off the new trading week, clipping back over the 43,000 handle and lurching 300 points higher after a Washington Post article suggested that incoming President Donald Trump and his team may be considering a more nuanced approach to widespread tariffs the President-elect has threatened to impose shortly after taking office.
Former and returning President Donald Trump was quick to voice resistance to the article, claiming that the Post story was wrong and that the incoming President still intends to impose a sweeping tariff package against most of the US’ closest allies and trading partners. Investors shrugged off the back-and-forth, clinging to the hopes that President Trump will be dissuaded from imposing what amounts to a flat 20% import tax on US consumers.
Final US S&P Global Purchasing Managers Index (PMI) figures somewhat missed the mark on Monday, with the Composite and Services PMIs for December both climbing from one month to the next, albeit less than analysts expected. Both indicators saw a slight downward revision from their preliminary prints, but still gained ground as the US economy churns on.
Dow Jones news
Markets are looking to reignite the tech rally juggernaut in 2025, pushing chipmakers higher and dragging most of the market higher alongside them. Nvidia (NVDA) soared over 4.5%, climbing above $151 per share. A distant second place goes to Goldman Sachs (GS) which rose around 2% to $590 per share.
Dow Jones price forecast
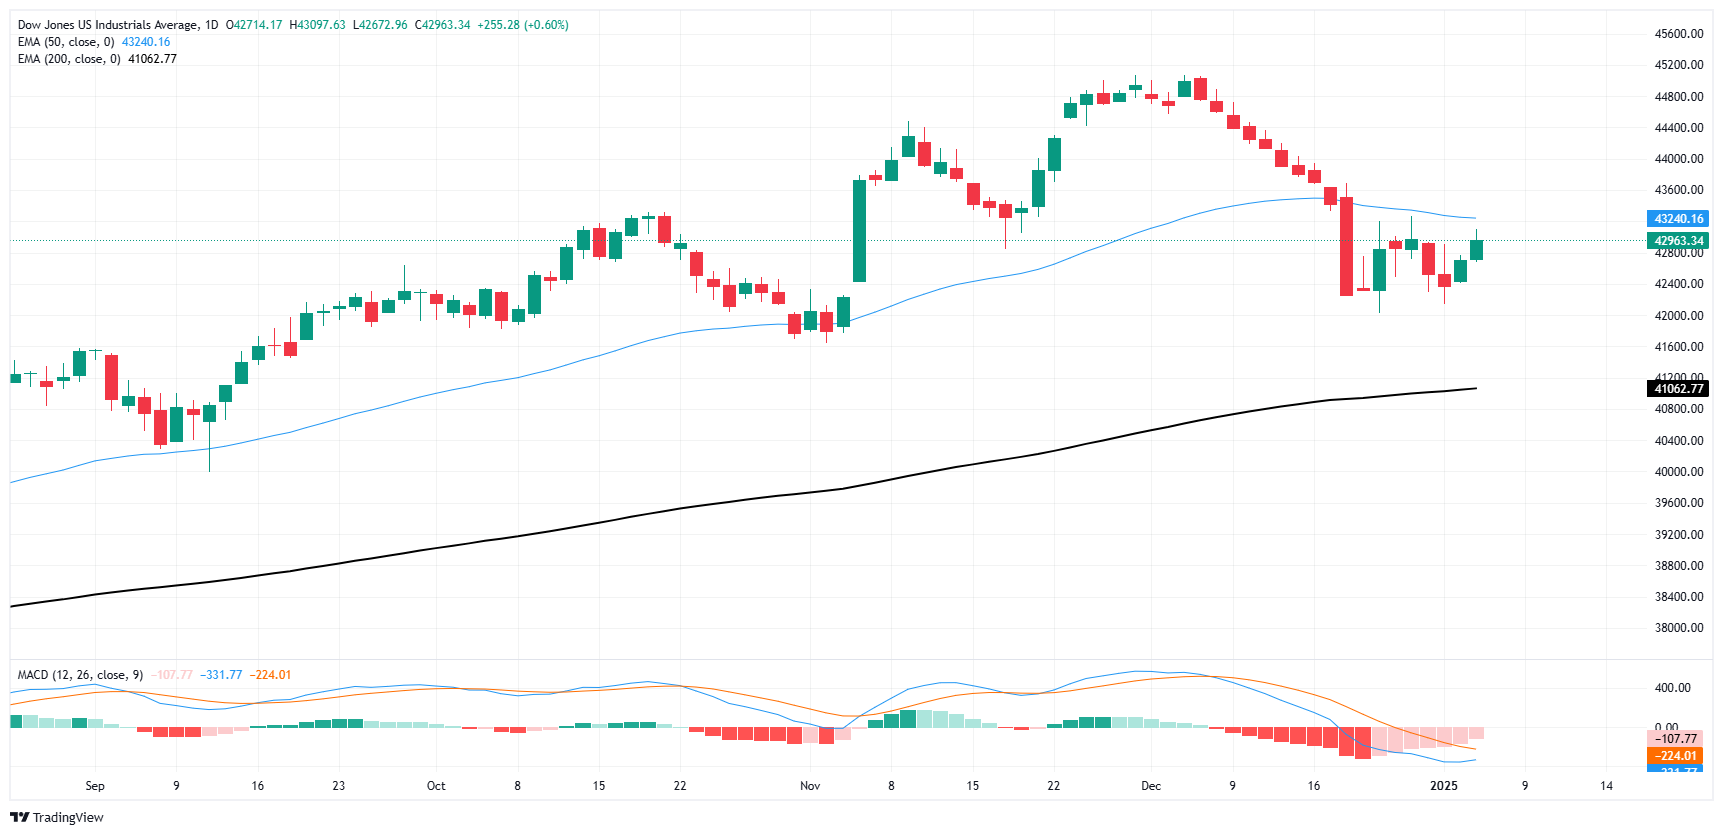
After a tepid start to the new trading year, the bulls are back on the block and the Dow Jones is getting pushed back above the 43,000 handle as bidders try to regain lost ground following the DJIA’s most recent downside plunge. The Dow Jones has rebounded 2.3% from a near-term swing low into the 42,000 region, but bidders still need to drag price action back above the 50-day Exponential Moving Average (EMA) at 43,225 before the bull market can be declared renewed.
Dow Jones daily chart
Economic Indicator
S&P Global Composite PMI
The S&P Global Composite Purchasing Managers Index (PMI), released on a monthly basis, is a leading indicator gauging US private-business activity in the manufacturing and services sector. The data is derived from surveys to senior executives. Each response is weighted according to the size of the company and its contribution to total manufacturing or services output accounted for by the sub-sector to which that company belongs. Survey responses reflect the change, if any, in the current month compared to the previous month and can anticipate changing trends in official data series such as Gross Domestic Product (GDP), industrial production, employment and inflation. The index varies between 0 and 100, with levels of 50.0 signaling no change over the previous month. A reading above 50 indicates that the private economy is generally expanding, a bullish sign for the US Dollar (USD). Meanwhile, a reading below 50 signals that activity is generally declining, which is seen as bearish for USD.
Read more.Last release: Mon Jan 06, 2025 14:45
Frequency: Monthly
Actual: 55.4
Consensus: 56.6
Previous: 56.6
Source: S&P Global
Author

Joshua Gibson
FXStreet
Joshua joins the FXStreet team as an Economics and Finance double major from Vancouver Island University with twelve years' experience as an independent trader focusing on technical analysis.


