Dow Jones Industrial Average Forecast: DJIA hits 14-month high as US data suggests less tightening
- Dow Jones breaks above old highs as weak US data suggests Fed may loosen its grip on tightening.
- Both US Retail Sales and Industrial Production undershoot expectations, suggesting economy is cooling off.
- DJIA pierces above the December 2022 highs at 34,940 to achieve new 14-month high.
The Dow Jones Industrial Average (DJIA) trades higher on Tuesday despite intially selling off. The two largest components in the Dow Jones – UnitedHealth Group (UNH) and Goldman Sachs (GS) – both advanced, helping keep the index in the black. Poor data from the US, including below-expectations Retail Sales and Industrial Production seemed to also have had an impact. Whilst there were signs weak Retail Sales may have weighed on the index in premarket trading, it rose after the release of poor industrial production data in the US.
Whilst it is possible to read the data as negative for the economy another equally valid interpretation is that it indicates the economy is cooling off by itself, which means the US Federal Reserve may not have as much tightening to do to bring down stubbornly high inflation. The latter would be positive for the DJIA since lower interest rates reduce the cost of borrowing and refinancing for many companies and is therefore viewed as positive for stocks in an environment of high inflation.
US Retail Sales for June showed lower-than-expected growth. Analysts had forecast the headline retail sales figure to show 0.5% MoM growth. Instead, it arrived at 0.2%. US Retail Sales ex-Autos was also reported at 0.2% MoM growth, while consensus had been 0.3%.
US Industrial Production came out at -0.5% in June when a flat 0.0% had been forecast by economists. Following on from the -0.5% registered in May it shows two consecutive months of shrinking output.
The Dow Jones has a number of components reporting earnings this week, including Goldman Sachs and IBM (IBM) on Wednesday and Johnson & Johnson (JNJ) and Travelers (TRV) on Thursday. American Express (AXP) reports on Friday.
Dow Jones News: Verizon under scrutiny for lead cables
Verizon (VZ) component lost 7.5% on Monday amidst worries concerning its liability for lead-sheathed cables. Verizon, AT&T (T) and several other legacy telecoms had a significant amount of lead-sheathed copper cables still in use around the United States. Many of these cables are quite old and stem from companies that have since been acquired by Verizon.
"[The] copper network deployed with possible lead sheathing could be a significant percentage of the legacy network deployed nationally with varying exposures for each firm," wrote Rollins in his client note.
These cables remain toxic for workers and the environment where they reside. Both stocks tanked immediately on the news, and Citi analyst Michael Rollins wrote on Monday that as much as 20% of Verizon’s copper cable infrastructure could be affected. It is thought that any liability lawsuits stemming from the lead toxicity could range into billions of dollars.
The good news for Dow Jones investors is that Verizon stock makes up a quite small portion of the index. At the beginning of 2023, Verizon accounted for just 0.73% of the index. VZ stock has since lost 21.6% year to date, so currently its sell-off is insignificant for the Dow Jones index.
Earnings come thick this week for Dow Jones components
The second-quarter earnings season has just gotten started, but Bank of America (BAC) already reported on Monday that 77% of earnings reports so far have beaten their consensus targets. Big banks like JPMorgan (JPM) – another Dow Jones component – already reported on Friday, and all of them showed generally impressive results.
Bank of America itself and PNC Financial (PNC) both beat their earnings marks as well on Tuesday morning, so it would seem the market may advance on the breadth of positive news. There is no impending recession to be seen in any of these big earnings releases so far.
On Wednesday, Goldman Sachs will release its quarterly results for the second quarter. Analysts have been unanimous in revising their earnings forecast lower for the investment bank over the past few months. Consensus is now for $4.14 in GAAP earnings per share (EPS) on revenue of $10.73 billion. This compares to $8.79 per share on $12.22 billion in Q1 revenues. Goldman stock is down 12.6% over the past six months.
IBM also reports Wednesday. Analyst consensus sits at $2 per share in adjusted EPS on $15.57 billion in sales. This compares to $2.36 in adjusted EPS one year ago. IBM shares are down 8.5% over the past six months.
Johnson & Johnson, the pharmaceutical giant, is expected to report $2.62 in adjusted EPS on Thursday. That amounts to meager growth from a year ago when the stalwart earnings $2.59 per share. Wall Street expects revenue to grow 3% YoY to $24.7 billion.
Travelers is expected to report $2.19 in adjusted EPS on revenue of $9.35 billion on Thursday. That earnings forecast is nearly a 15% decline from the $2.57 reported in the same quarter one year ago.
Wall Street analysts predict that American Express will earn $2.82 in adjusted EPS on $15.36 billion. This marks the payments platform as one of the few Dow companies that Wall Street is bullish on since that consensus would mean robust growth for the company.
Dow Jones Technical Outlook: Long-term uptrend resuming
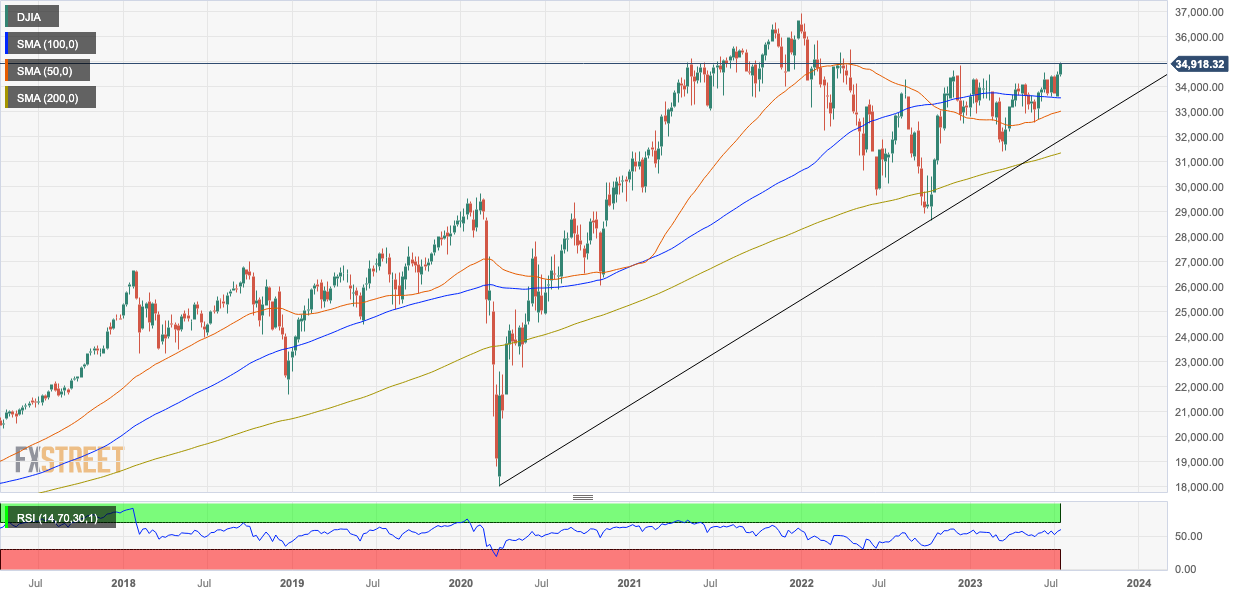
The Dow Jones is in a long-term uptrend and despite the pullback in October 2022 this trend appears to be resuming and is now not far off the index's all time highs. Given the old adage that "the trend is your friend until the bend at the end" the overall picture is bullish with the long-term uptrend favored to continue.
Additionally the index trades above all its major moving averages, further suggesting underlying strength in the uptrend, and the Relative Strength Index is not yet overbought, indicating there is room for more gains.
DJIA: Weekly Chart
The daily chart shows today's break above the December 2022 highs. Assuming price holds above these highs in a decisive break higher, the index is poised to continue rallying to the next key resistance level, likely to be at around the 35,500 level of the April 2022 lower high.
A decisive break higher is one in which the candlestick is longer than average, breaks clearly through the critical level in question and closes near its high. Alternatively it can also be composed of three consecutive green candlsticks that break clearly above the level.
-638252964054960940.png)
DJIA: Daily Chart
The one slight fly in the soup for bulls is that the RSI is currently at 68 which is close to the 70 threshold signalling overbought. If it goes above 70 the probabilities increase that the index will pullback. An overbought state is an indication to traders not to increase their long holdings – it is not yet a signal to sell. Prices often continue rising well after they reach overbought and it is only when the RSI turns back down below 70 again that the signal to sell is given.
Dow Jones FAQs
What is the Dow Jones?
The Dow Jones Industrial Average, one of the oldest stock market indices in the world, is compiled of the 30 most traded stocks in the US. The index is price-weighted rather than weighted by capitalization. It is calculated by summing the prices of the constituent stocks and dividing them by a factor, currently 0.152. The index was founded by Charles Dow, who also founded the Wall Street Journal. In later years it has been criticized for not being broadly representative enough because it only tracks 30 conglomerates, unlike broader indices such as the S&P 500.
What factors impact the Dow Jones Industrial Average?
Many different factors drive the Dow Jones Industrial Average (DJIA). The aggregate performance of the component companies revealed in quarterly company earnings reports is the main one. US and global macroeconomic data also contributes as it impacts on investor sentiment. The level of interest rates, set by the Federal Reserve (Fed), also influences the DJIA as it affects the cost of credit, on which many corporations are heavily reliant. Therefore, inflation can be a major driver as well as other metrics which impact the Fed decisions.
What is Dow Theory?
Dow Theory is a method for identifying the primary trend of the stock market developed by Charles Dow. A key step is to compare the direction of the Dow Jones Industrial Average (DJIA) and the Dow Jones Transportation Average (DJTA) and only follow trends where both are moving in the same direction. Volume is a confirmatory criteria. The theory uses elements of peak and trough analysis. Dow’s theory posits three trend phases: accumulation, when smart money starts buying or selling; public participation, when the wider public joins in; and distribution, when the smart money exits.
How can I trade the DJIA?
There are a number of ways to trade the DJIA. One is to use ETFs which allow investors to trade the DJIA as a single security, rather than having to buy shares in all 30 constituent companies. A leading example is the SPDR Dow Jones Industrial Average ETF (DIA). DJIA futures contracts enable traders to speculate on the future value of the index and Options provide the right, but not the obligation, to buy or sell the index at a predetermined price in the future. Mutual funds enable investors to buy a share of a diversified portfolio of DJIA stocks thus providing exposure to the overall index.
Premium
You have reached your limit of 3 free articles for this month.
Start your subscription and get access to all our original articles.
Author

Clay Webster
FXStreet
Clay Webster grew up in the US outside Buffalo, New York and Lancaster, Pennsylvania. He began investing after college following the 2008 financial crisis.


