- Dow Jones Industrial Index rose 1.94% last week and has advanced slightly this week as well.
- US Initial Jobless Claims came in well below expectations.
- Durable Goods Orders dropped 5.4% MoM, well below consensus.
- Preliminary Manufacturing and Services PMIs arrive on Friday during a shortened trading session.
The Dow Jones Industrial Average (DJIA) outperformed the NASDAQ Composite (0.46%) and the S&P 500 (0.41%) on Wednesday ahead of the Thanksgiving holiday. The DJIA closed up 0.53% as Microsoft (MSFT) and The Home Depot (HD) both added just under 1.3%.
The DJIA rose 1.94% last week, its third week of gains, and has also been gathering steam this week. Nvidia (NVDA) earnings late Tuesday amounted to an impressive beat, but the premier semiconductor stock closed down 2.5% on Wednesday.
Lower Initial Jobless Claims are demonstrating that the US labor market is not collapsing as some estimated last week, but Durable Goods Orders fell much further than the market expected.
Dow Jones News: Hawkish FOMC Minutes fail to dissuade bulls
Nvidia earnings may not have meant much for Nvidia itself, as expectations were so high, but the market seems to be benefiting from them. All three major Wall Street indices opened higher on Wednesday. CEO Jensen Huang’s company raised its outlook by more than $2 billion for fourth-quarter revenue, an event that seems unlikely if a recession were on the horizon.
Tuesday’s hawkish FOMC Minutes have also failed to alter the market’s bullish foundation. The CME Group FedWatch Tool has placed the odds of an interest rate cut at 62% for the Federal Reserve’s May meeting. The March meeting continues to see odds of a cut near 29%.
The Fed left the door open for more hikes, but the market is not in agreement. The soft landing thesis is still leading the narrative. Initial Jobless Claims for the week ending November 18 arrived at 209K – well below the consensus of 225K. It was still a positive reading as it was a 24K decrease from the previous week’s 233K reading (revised 2K higher). Placid, ho-hum Initial Jobless Claims are what the market wants, however, as it reads as a labor market sustaining its health but low enough not to trigger Fed hawks.
Durable Goods Orders for October fell 5.4% rather than the 3.1% drop that was expected. This could be a seasonal decline, but a large drop below consensus for November could worry the market.
The Michigan Consumer Sentiment Index for November arrived Wednesday morning at 61.3, above the consensus for 60.5 and the previous month’s 60.4 print. S&P Global PMIs for Manufacturing and Services will be released on Friday.
Dow Jones FAQs
What is the Dow Jones?
The Dow Jones Industrial Average, one of the oldest stock market indices in the world, is compiled of the 30 most traded stocks in the US. The index is price-weighted rather than weighted by capitalization. It is calculated by summing the prices of the constituent stocks and dividing them by a factor, currently 0.152. The index was founded by Charles Dow, who also founded the Wall Street Journal. In later years it has been criticized for not being broadly representative enough because it only tracks 30 conglomerates, unlike broader indices such as the S&P 500.
What factors impact the Dow Jones Industrial Average?
Many different factors drive the Dow Jones Industrial Average (DJIA). The aggregate performance of the component companies revealed in quarterly company earnings reports is the main one. US and global macroeconomic data also contributes as it impacts on investor sentiment. The level of interest rates, set by the Federal Reserve (Fed), also influences the DJIA as it affects the cost of credit, on which many corporations are heavily reliant. Therefore, inflation can be a major driver as well as other metrics which impact the Fed decisions.
What is Dow Theory?
Dow Theory is a method for identifying the primary trend of the stock market developed by Charles Dow. A key step is to compare the direction of the Dow Jones Industrial Average (DJIA) and the Dow Jones Transportation Average (DJTA) and only follow trends where both are moving in the same direction. Volume is a confirmatory criteria. The theory uses elements of peak and trough analysis. Dow’s theory posits three trend phases: accumulation, when smart money starts buying or selling; public participation, when the wider public joins in; and distribution, when the smart money exits.
How can I trade the DJIA?
There are a number of ways to trade the DJIA. One is to use ETFs which allow investors to trade the DJIA as a single security, rather than having to buy shares in all 30 constituent companies. A leading example is the SPDR Dow Jones Industrial Average ETF (DIA). DJIA futures contracts enable traders to speculate on the future value of the index and Options provide the right, but not the obligation, to buy or sell the index at a predetermined price in the future. Mutual funds enable investors to buy a share of a diversified portfolio of DJIA stocks thus providing exposure to the overall index.
Dow Jones Industrial Average forecast: Overbought after November rally
The Dow Jones index has risen above the late August highs over the past week and is now gunning to take out the August 1 high sometime in December. That 35,679 high was the highest the index has reached in about 18 months, and a close above that level signifies that the index is back in bullish territory.
In the near term, investors will note that the Relative Strength Index (RSI) has reached overbought levels. Typically, this means that a pullback is in order. If the 35,000 resistance level turns into support, then the 34,300 to 34,700 demand zone could do the trick. Otherwise, the 50-day Simple Moving average (SMA) is hovering just below the early November consolidation just below 33,900.
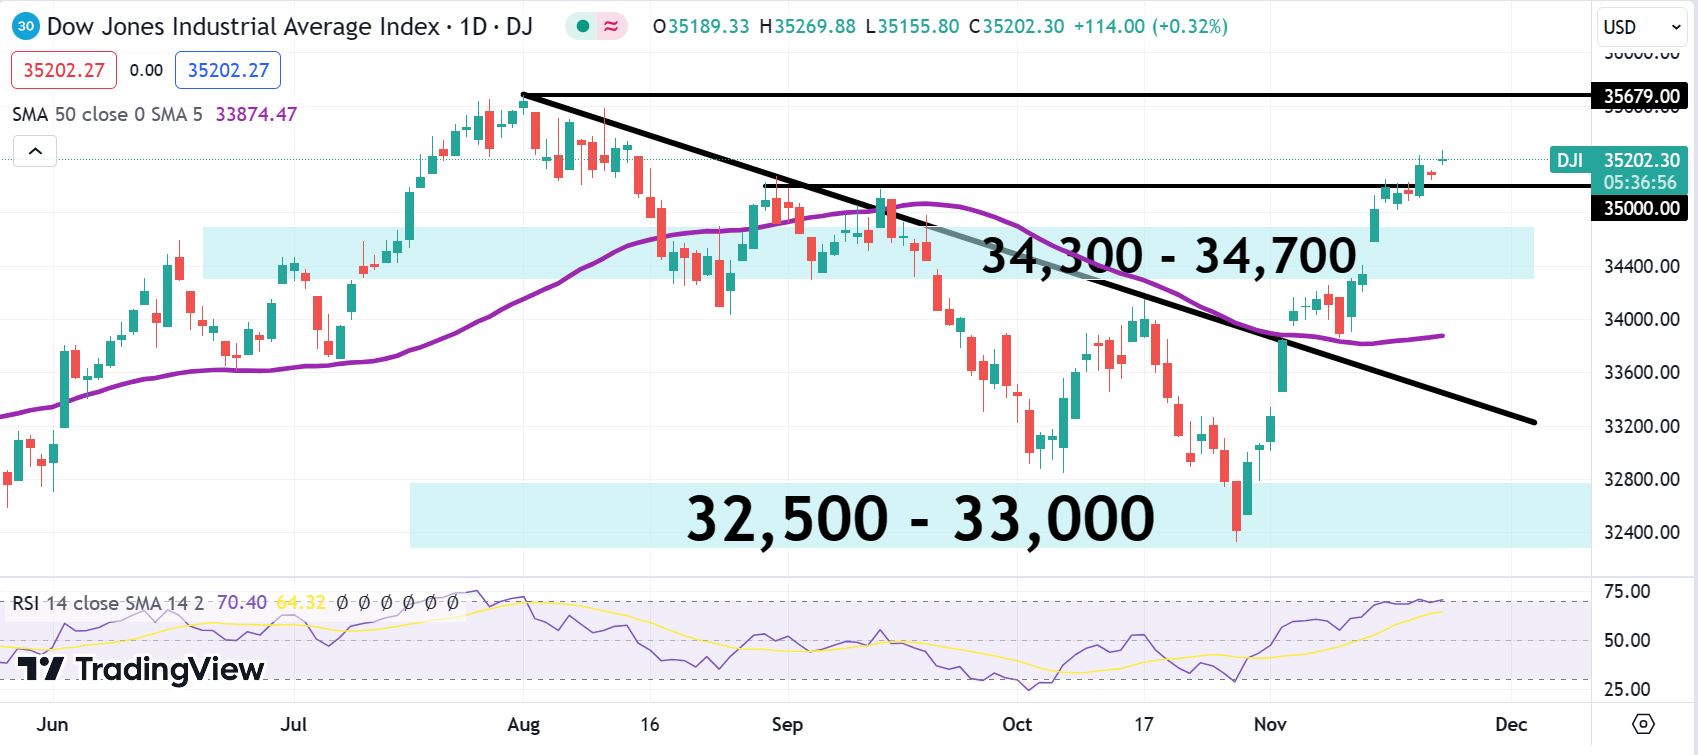
Dow Jones Industrial Average daily chart
Information on these pages contains forward-looking statements that involve risks and uncertainties. Markets and instruments profiled on this page are for informational purposes only and should not in any way come across as a recommendation to buy or sell in these assets. You should do your own thorough research before making any investment decisions. FXStreet does not in any way guarantee that this information is free from mistakes, errors, or material misstatements. It also does not guarantee that this information is of a timely nature. Investing in Open Markets involves a great deal of risk, including the loss of all or a portion of your investment, as well as emotional distress. All risks, losses and costs associated with investing, including total loss of principal, are your responsibility. The views and opinions expressed in this article are those of the authors and do not necessarily reflect the official policy or position of FXStreet nor its advertisers. The author will not be held responsible for information that is found at the end of links posted on this page.
If not otherwise explicitly mentioned in the body of the article, at the time of writing, the author has no position in any stock mentioned in this article and no business relationship with any company mentioned. The author has not received compensation for writing this article, other than from FXStreet.
FXStreet and the author do not provide personalized recommendations. The author makes no representations as to the accuracy, completeness, or suitability of this information. FXStreet and the author will not be liable for any errors, omissions or any losses, injuries or damages arising from this information and its display or use. Errors and omissions excepted.
The author and FXStreet are not registered investment advisors and nothing in this article is intended to be investment advice.


Recommended content
Editors’ Picks

EUR/USD bounces off lows, retests 1.1370
Following an early drop to the vicinity of 1.1310, EUR/USD now manages to regain pace and retargets the 1.1370-1.1380 band on the back of a tepid knee-jerk in the US Dollar, always amid growing optimism over a potential de-escalation in the US-China trade war.

GBP/USD consolidates losses near 1.3300 after UK Retail Sales data
GBP/USD remains under moderate selling pressure near 1.3300 despite the upbeat UK Retail Sales data for March. The pair feels the heat of the solid US Dollar rebound, aided by latest headlines hinting at a softening rhetoric in the ongoing US-China trade conflict.

Gold drops toward $3,250 as market mood improves
Gold turns south following Thursday's rebound and declines toward $3,250 on Friday. The bearish pressure builds up as market mood improves on growing optimism about a de-escalation of the US-China trade conflict after US President Trump hinted at the beginning of negotiations.

Ethereum: Accumulation addresses grab 1.11 million ETH as bullish momentum rises
Ethereum saw a 1% decline on Friday as sellers dominated exchange activity in the past 24 hours. Despite the recent selling, increased inflows into accumulation addresses and declining net taker volume show a gradual return of bullish momentum.

Week ahead: US GDP, inflation and jobs in focus amid tariff mess – BoJ meets
Barrage of US data to shed light on US economy as tariff war heats up. GDP, PCE inflation and nonfarm payrolls reports to headline the week. Bank of Japan to hold rates but may downgrade growth outlook. Eurozone and Australian CPI also on the agenda, Canadians go to the polls.

The Best brokers to trade EUR/USD
SPONSORED Discover the top brokers for trading EUR/USD in 2025. Our list features brokers with competitive spreads, fast execution, and powerful platforms. Whether you're a beginner or an expert, find the right partner to navigate the dynamic Forex market.