Dow Jones Industrial Average shrugs off declining consumer sentiment, climbs 125 points on Friday
- Dow Jones climbs 0.32% as investors grapple with pullback in consumer confidence.
- UoM Consumer Sentiment, Inflation Expectations come in worse than expected.
- Fedspeak dominates the headlines as policymakers talk down rate cut hopes.
The Dow Jones Industrial Average (DJIA) gained 125 points on Friday as equities try to shake off a decline in the University of Michigan’s Consumer Sentiment Index which showed US consumers are increasingly concerned about long-run inflation taking hold. Consumer 5-year Inflation Expectations ticked higher as the US economy begins to buckle under the weight of price growth runner even hotter and longer than previously expected.
The UoM’s Consumer Sentiment Index for May declined sharply to 67.4 in May, falling well below the market forecast 76.0 and hitting its lowest figure in six months as consumer confidence deteriorates. 5-year Consumer Inflation Expectations also ticked higher to 3.1% in May compared to the previous 3.0%.
Multiple Federal Reserve (Fed) officials hit the newswires on Friday as central planners try to talk down broad-market expectations for rate cuts in 2024 in the face of recent stubborn inflation figures.
Read more:
Fed’s Bowman: I don't see rate cuts as warranted this year
Fed's Goolsbee: Housing remains a significant inflation challenge
Fed's Logan: Too early to think about cutting rates
Dow Jones news
The Dow Jones Industrial Average was the top-performing US equity index on Friday, gaining around a third of a percent in the last market session of the trading week. A third of the securities that comprise the Dow Jones still declined on the day, with the losses being led by Nike Inc. (NKE). Nike lost -2.62% on Friday, declining below $91.00 per share. On the upside, McDonald's Corp. (MCD) pulled ahead of the rest of the pack, gaining 2.63%. McDonald's gained seven points to close Friday trading at $275.00 per share.
Dow Jones technical outlook
Despite hobbled risk appetite in broader markets, the Dow Jones managed to set a new peak for the week, trading into 39,579.23 before settling back to the 39,500.00 region. Top side momentum is set to stall with the Dow Jones appearing overextended. The major equity index is trading well above the 200-day Exponential Moving Average (EMA) at 36,893.00.
The Dow Jones ended a seventh consecutive day in the green, and the index is up around 2% for the week.
Dow Jones hourly chart
Dow Jones daily chart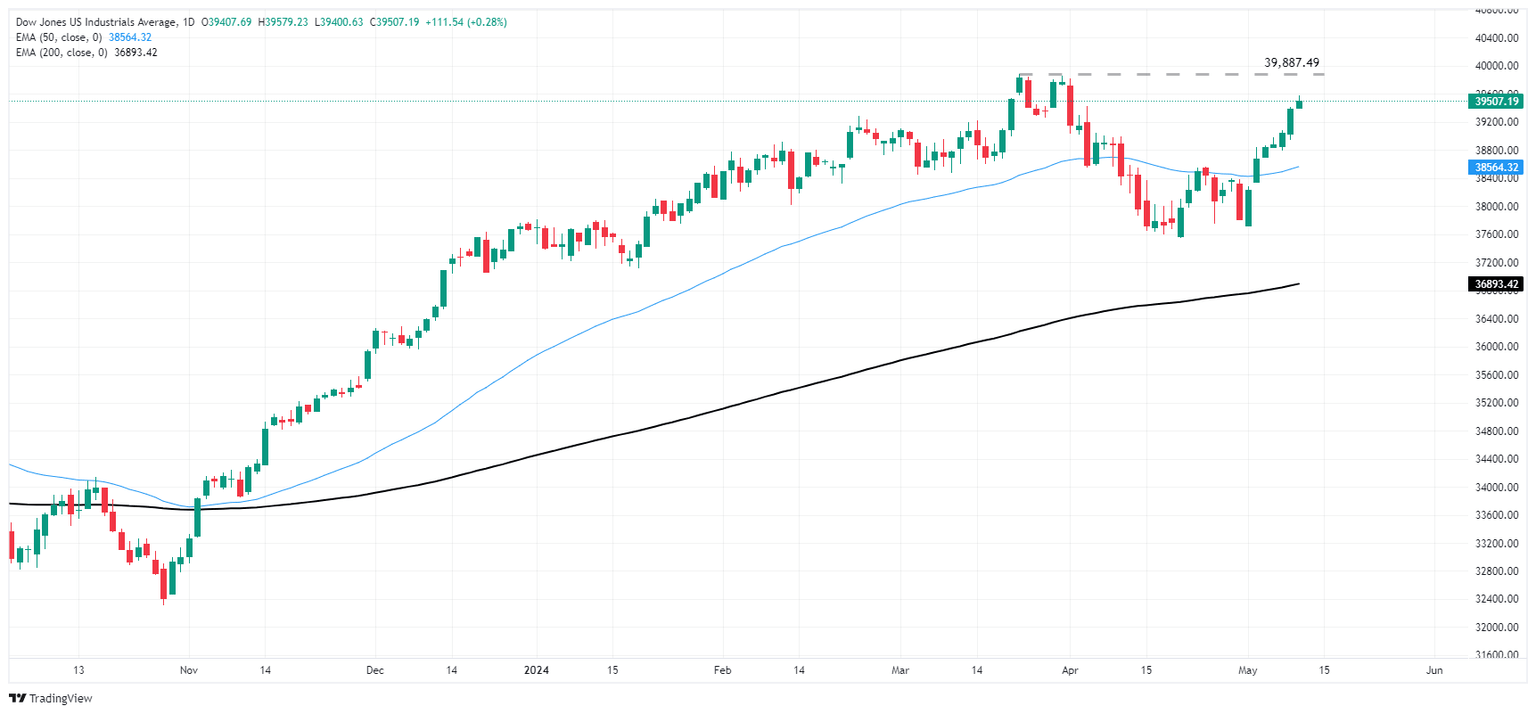
Dow Jones FAQs
The Dow Jones Industrial Average, one of the oldest stock market indices in the world, is compiled of the 30 most traded stocks in the US. The index is price-weighted rather than weighted by capitalization. It is calculated by summing the prices of the constituent stocks and dividing them by a factor, currently 0.152. The index was founded by Charles Dow, who also founded the Wall Street Journal. In later years it has been criticized for not being broadly representative enough because it only tracks 30 conglomerates, unlike broader indices such as the S&P 500.
Many different factors drive the Dow Jones Industrial Average (DJIA). The aggregate performance of the component companies revealed in quarterly company earnings reports is the main one. US and global macroeconomic data also contributes as it impacts on investor sentiment. The level of interest rates, set by the Federal Reserve (Fed), also influences the DJIA as it affects the cost of credit, on which many corporations are heavily reliant. Therefore, inflation can be a major driver as well as other metrics which impact the Fed decisions.
Dow Theory is a method for identifying the primary trend of the stock market developed by Charles Dow. A key step is to compare the direction of the Dow Jones Industrial Average (DJIA) and the Dow Jones Transportation Average (DJTA) and only follow trends where both are moving in the same direction. Volume is a confirmatory criteria. The theory uses elements of peak and trough analysis. Dow’s theory posits three trend phases: accumulation, when smart money starts buying or selling; public participation, when the wider public joins in; and distribution, when the smart money exits.
There are a number of ways to trade the DJIA. One is to use ETFs which allow investors to trade the DJIA as a single security, rather than having to buy shares in all 30 constituent companies. A leading example is the SPDR Dow Jones Industrial Average ETF (DIA). DJIA futures contracts enable traders to speculate on the future value of the index and Options provide the right, but not the obligation, to buy or sell the index at a predetermined price in the future. Mutual funds enable investors to buy a share of a diversified portfolio of DJIA stocks thus providing exposure to the overall index.
Author

Joshua Gibson
FXStreet
Joshua joins the FXStreet team as an Economics and Finance double major from Vancouver Island University with twelve years' experience as an independent trader focusing on technical analysis.


