Dow Jones Industrial Average halts declines as bond yields ease
- The Dow Jones found a foothold near the 42,000 level on Thursday.
- President Trump’s tax bill survived the House and now heads to the Senate.
- US PMI figures rebounded firmly in May, flouting market forecasts.

The Dow Jones Industrial Average (DJIA) bounced off a fresh bottom on Thursday, clawing its way out of the basement after a sharp tumble during the midweek trading window. On Wednesday, bond yields rose and equities took a hit as fresh concerns about the United States(US) government’s ever-increasing debtload emerged. Investors have seemingly shrugged off their concerns and resumed bidding up stocks after Congressional Republicans successfully pushed through President Trump’s “big, beautiful bill” on the federal budget and taxation, which is expected to add trillions to the federal deficit over the next ten years.
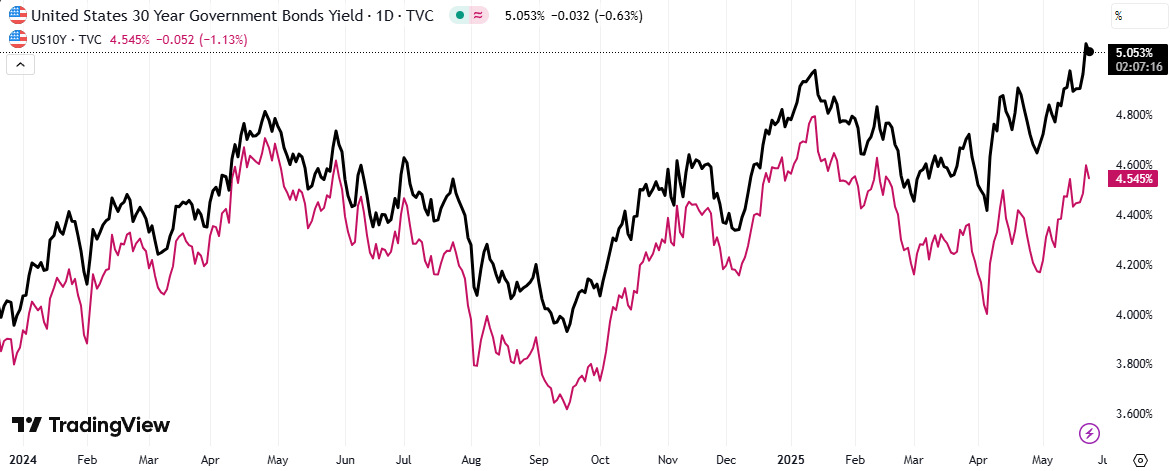
Bond markets remain on shaky footing, limiting upside momentum and boxing the Dow Jones out of a clear bullish reversal. The 30-year Treasury yield is still parked north of 5%, and despite a slight easing, the 10-year yield remains above 4.5%. Rising funding costs come at a time when the Trump administration is hoping to help alleviate budget pressure from its planned steep tax cuts using cheap debt. However, rising (or at least sticky) bond yields, coupled with a Federal Reserve (Fed) that remains staunchly apprehensive about cutting interest rates ahead of possible economic fallout from Trump tariffs, are systematically taking a hatchet to those plans.
US Purchasing Managers Index (PMI) figures rose in May as business operators pivoted toward optimism more than expected in the aggregate. The Services and Manufacturing components of the indexed business survey results both rose to 52.3, from 50.2 for Services and 50.8 for Manufacturing.
Dow Jones price forecast
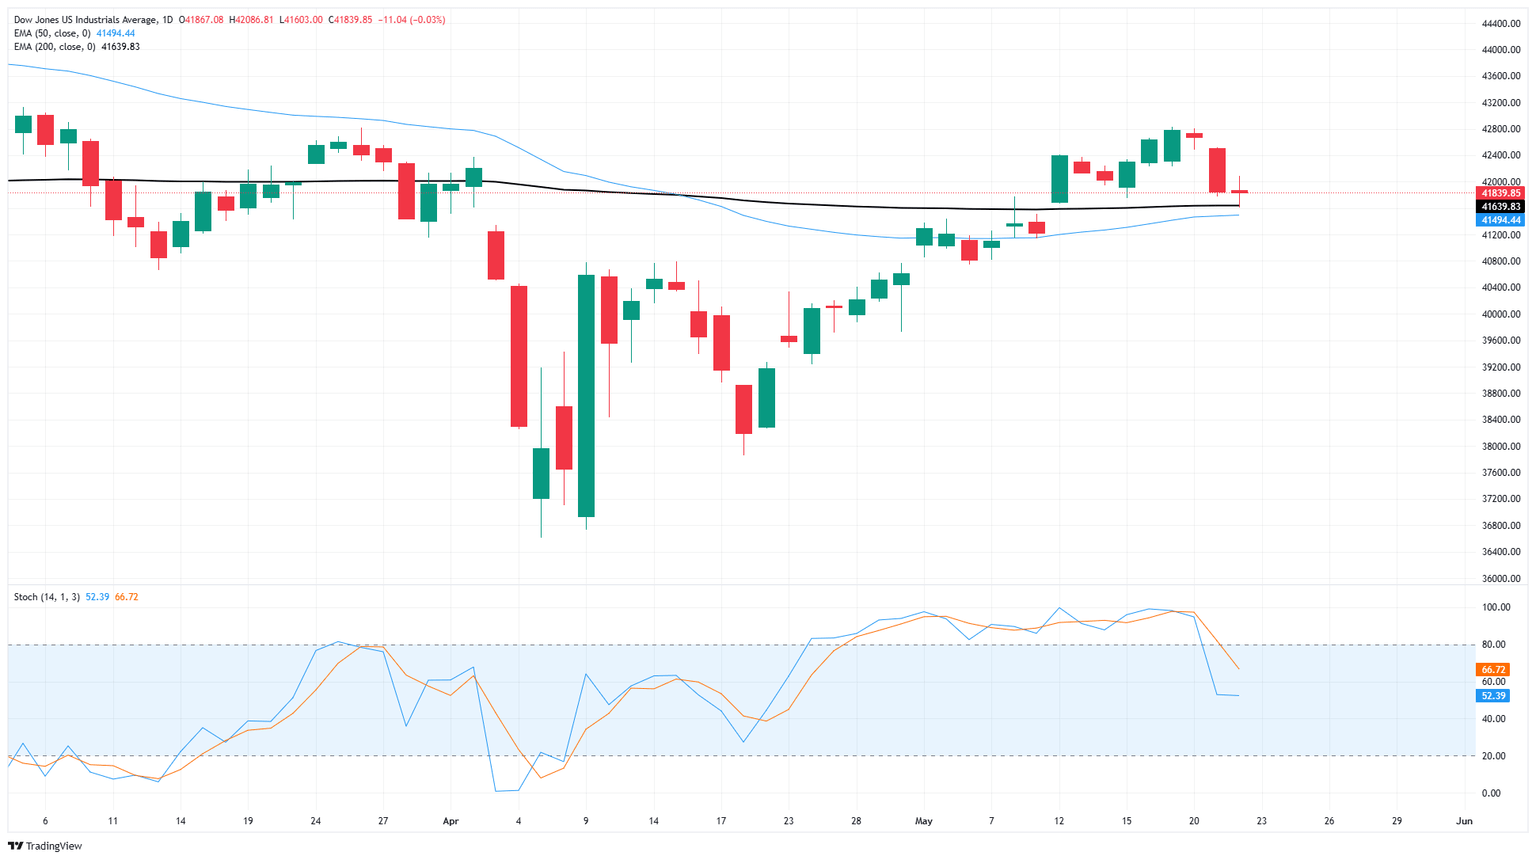
The Dow Jones Industrial Average tested the 200-day Exponential Moving Average (EMA) near 41,640 early Thursday before equity markets found their footing and pushed intraday bids back into the 42,000 handle. Price action is still overall bullish, but a near-term decline has bled some of the wind out of the Dow Jones’ sails.
Dow Jones daily chart
Economic Indicator
S&P Global Manufacturing PMI
The S&P Global Manufacturing Purchasing Managers Index (PMI), released on a monthly basis, is a leading indicator gauging business activity in the US manufacturing sector. The data is derived from surveys of senior executives at private-sector companies from the manufacturing sector. Survey responses reflect the change, if any, in the current month compared to the previous month and can anticipate changing trends in official data series such as Gross Domestic Product (GDP), industrial production, employment and inflation. A reading above 50 indicates that the manufacturing economy is generally expanding, a bullish sign for the US Dollar (USD). Meanwhile, a reading below 50 signals that activity in the manufacturing sector is generally declining, which is seen as bearish for USD.
Read more.Last release: Thu May 22, 2025 13:45 (Prel)
Frequency: Monthly
Actual: 52.3
Consensus: 50.1
Previous: 50.2
Source: S&P Global
Author

Joshua Gibson
FXStreet
Joshua joins the FXStreet team as an Economics and Finance double major from Vancouver Island University with twelve years' experience as an independent trader focusing on technical analysis.


