- The Dow Jones shed around 100 points on Thursday before grinding back to the middle.
- US CPI data came in hotter than expected, US Initial Jobless Claims also rose.
- Markets are firmly planted in bets for a 25 bps November cut.
The Dow Jones Industrial Average (DJIA) pared back on some of the week’s earlier gains after US Consumer Price Index (CPI) inflation figures from September failed to meet market expectations. US Initial Jobless Claims also accelerated to its highest week-on-week figure in over a year, flashing a warning sign that the labor market, while still relatively healthy, still has plenty of wiggle room for some slack in employment figures.
Headline US CPI inflation ticked down to 2.4% YoY in September, easing back from the previous 2.5%, but stuck stubbornly higher than the expected 2.3%. Annualized core CPI inflation also ticked higher to 3.3%, flummoxing the anticipated hold at 3.2%. Still-sticky inflation figures threaten market hopes for a faster, deeper pace of rate cuts from the Federal Reserve (Fed).
US Initial Jobless Claims rose to 258K for the week ended October 4, over and above the expected 230K and climbing above the previous week’s print of 225K. While still within the realm of reasonable, it was still the highest level of week-on-week new unemployment benefits seekers since May of 2023.
Investors are left in a tricky position after Thursday’s data points: Still-high inflation makes it even harder for the Fed to deliver further rate cuts, but softening labor figures could tilt the Fed into further, deeper rate trims. However, too-steep of a pivot into souring labor data would be a significant warning sign of an impending recession, which would certainly spike the pace of Fed rate cuts higher, but would outright threaten the stability of equity markets.
According to the CME’s FedWatch Tool, rate traders have piled back into bets of a 25 bps rate trim in November, with 90% odds the Fed will deliver a quarter-point rate cut on November 7. The remaining 10% pool is expecting no move at all from the Fed next month.
Dow Jones news
The Dow Jones struggled its way back to the even mark after an initial 100-point dump to kick off Thursday’s US market session. Despite recovering balance, a full two-thirds of the major equity board is testing into the red for the day. Amazon (AMZN) still managed to find the high side, climbing over 1% and testing north of $187 per share.
Dow Jones price forecast
The Dow Jones Industrial Average (DJIA) is showing signs of consolidation after rallying from early October lows. It's trading just below recent highs above 42600, with a slight 0.10% decline for the day. The 50-day exponential moving average (EMA) at 41,300 is providing strong support, and price action remains well above both the 50-day and the 200-day EMA at 39,173, confirming the broader uptrend.
Momentum indicators are showing mixed signals. The Moving Average Convergence Divergence (MACD) line is slightly above the signal line, suggesting a slowdown in upward momentum. Traders are closely monitoring whether the MACD line will cross below the signal line, which could be an early sign of a short-term pullback.
As long as the index continues to trade above key support levels, the upward trend remains intact. However, a break below the 50-day EMA could trigger more pronounced selling pressure, potentially pushing the index toward the 200-day EMA. Traders will be closely watching to see if the index can surpass current resistance levels or if it will enter a period of consolidation amid uncertainties in the macroeconomic environment.
Dow Jones daily chart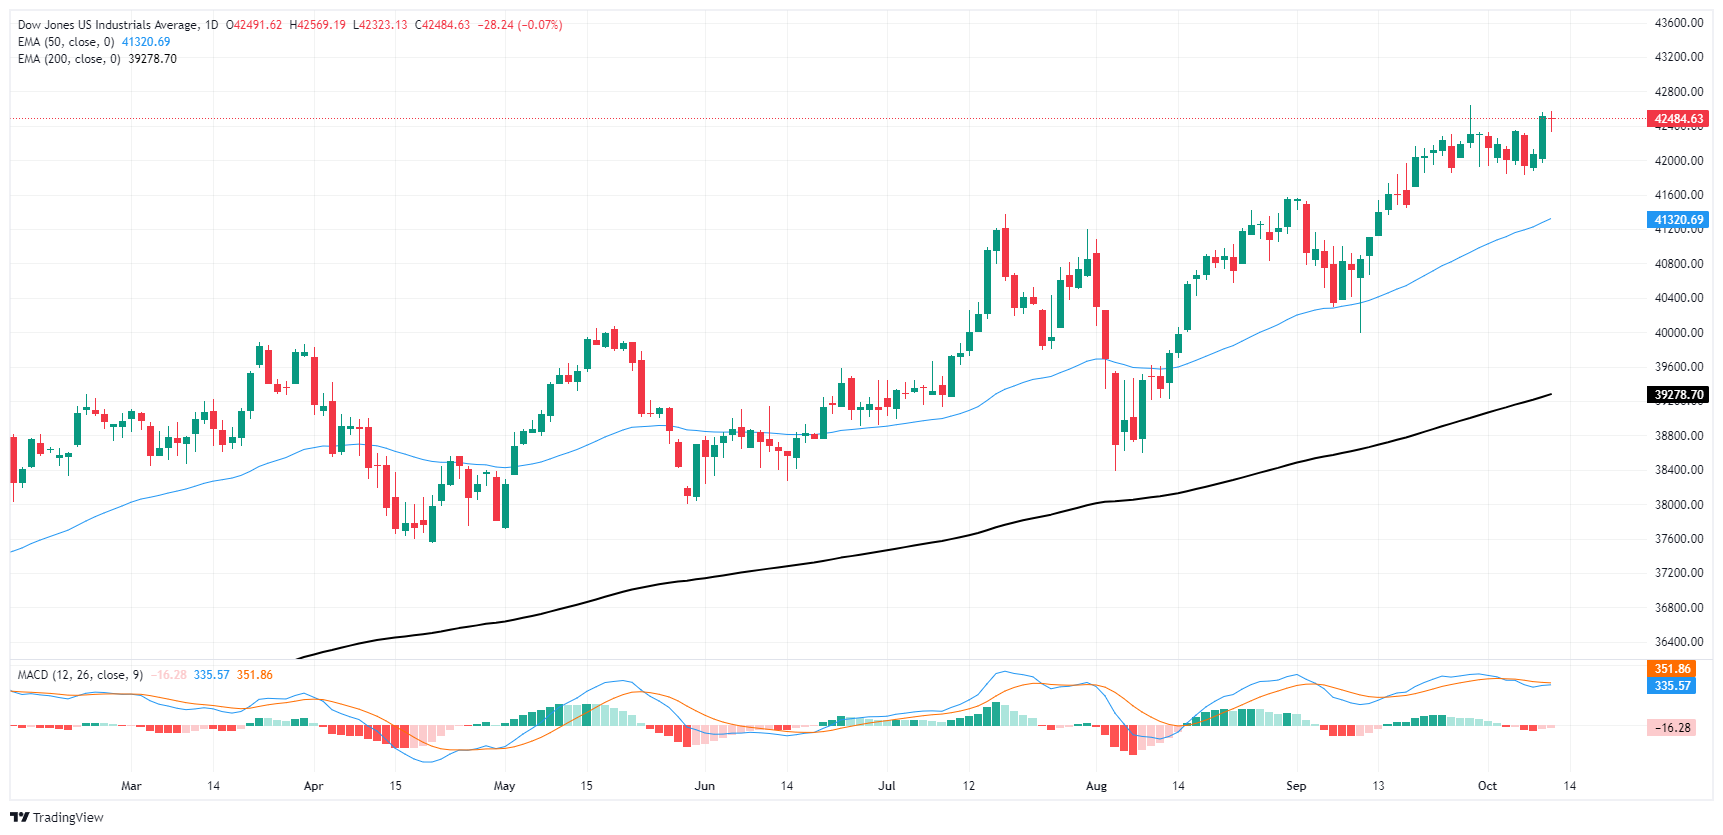
Inflation FAQs
Inflation measures the rise in the price of a representative basket of goods and services. Headline inflation is usually expressed as a percentage change on a month-on-month (MoM) and year-on-year (YoY) basis. Core inflation excludes more volatile elements such as food and fuel which can fluctuate because of geopolitical and seasonal factors. Core inflation is the figure economists focus on and is the level targeted by central banks, which are mandated to keep inflation at a manageable level, usually around 2%.
The Consumer Price Index (CPI) measures the change in prices of a basket of goods and services over a period of time. It is usually expressed as a percentage change on a month-on-month (MoM) and year-on-year (YoY) basis. Core CPI is the figure targeted by central banks as it excludes volatile food and fuel inputs. When Core CPI rises above 2% it usually results in higher interest rates and vice versa when it falls below 2%. Since higher interest rates are positive for a currency, higher inflation usually results in a stronger currency. The opposite is true when inflation falls.
Although it may seem counter-intuitive, high inflation in a country pushes up the value of its currency and vice versa for lower inflation. This is because the central bank will normally raise interest rates to combat the higher inflation, which attract more global capital inflows from investors looking for a lucrative place to park their money.
Formerly, Gold was the asset investors turned to in times of high inflation because it preserved its value, and whilst investors will often still buy Gold for its safe-haven properties in times of extreme market turmoil, this is not the case most of the time. This is because when inflation is high, central banks will put up interest rates to combat it. Higher interest rates are negative for Gold because they increase the opportunity-cost of holding Gold vis-a-vis an interest-bearing asset or placing the money in a cash deposit account. On the flipside, lower inflation tends to be positive for Gold as it brings interest rates down, making the bright metal a more viable investment alternative.
Information on these pages contains forward-looking statements that involve risks and uncertainties. Markets and instruments profiled on this page are for informational purposes only and should not in any way come across as a recommendation to buy or sell in these assets. You should do your own thorough research before making any investment decisions. FXStreet does not in any way guarantee that this information is free from mistakes, errors, or material misstatements. It also does not guarantee that this information is of a timely nature. Investing in Open Markets involves a great deal of risk, including the loss of all or a portion of your investment, as well as emotional distress. All risks, losses and costs associated with investing, including total loss of principal, are your responsibility. The views and opinions expressed in this article are those of the authors and do not necessarily reflect the official policy or position of FXStreet nor its advertisers. The author will not be held responsible for information that is found at the end of links posted on this page.
If not otherwise explicitly mentioned in the body of the article, at the time of writing, the author has no position in any stock mentioned in this article and no business relationship with any company mentioned. The author has not received compensation for writing this article, other than from FXStreet.
FXStreet and the author do not provide personalized recommendations. The author makes no representations as to the accuracy, completeness, or suitability of this information. FXStreet and the author will not be liable for any errors, omissions or any losses, injuries or damages arising from this information and its display or use. Errors and omissions excepted.
The author and FXStreet are not registered investment advisors and nothing in this article is intended to be investment advice.
Recommended content
Editors’ Picks

EUR/USD extends recovery beyond 1.0400 amid Wall Street's turnaround
EUR/USD extends its recovery beyond 1.0400, helped by the better performance of Wall Street and softer-than-anticipated United States PCE inflation. Profit-taking ahead of the winter holidays also takes its toll.

GBP/USD nears 1.2600 on renewed USD weakness
GBP/USD extends its rebound from multi-month lows and approaches 1.2600. The US Dollar stays on the back foot after softer-than-expected PCE inflation data, helping the pair edge higher. Nevertheless, GBP/USD remains on track to end the week in negative territory.

Gold rises above $2,620 as US yields edge lower
Gold extends its daily rebound and trades above $2,620 on Friday. The benchmark 10-year US Treasury bond yield declines toward 4.5% following the PCE inflation data for November, helping XAU/USD stretch higher in the American session.

Bitcoin crashes to $96,000, altcoins bleed: Top trades for sidelined buyers
Bitcoin (BTC) slipped under the $100,000 milestone and touched the $96,000 level briefly on Friday, a sharp decline that has also hit hard prices of other altcoins and particularly meme coins.
Bank of England stays on hold, but a dovish front is building
Bank of England rates were maintained at 4.75% today, in line with expectations. However, the 6-3 vote split sent a moderately dovish signal to markets, prompting some dovish repricing and a weaker pound. We remain more dovish than market pricing for 2025.

Best Forex Brokers with Low Spreads
VERIFIED Low spreads are crucial for reducing trading costs. Explore top Forex brokers offering competitive spreads and high leverage. Compare options for EUR/USD, GBP/USD, USD/JPY, and Gold.