Dow Jones Industrial Average clips new record bids on thin Monday volumes
- Dow Jones taps a new record high despite thin volumes.
- Moves in equities remain limited as investors recover from Fed splurge.
- Key US inflation data looms large at the end of the week.
The Dow Jones Industrial Average (DJIA) slipped higher to test a new record high of 41,419.65 on Monday, but investors are still recovering from last Friday’s surge after the Federal Reserve (Fed) all but confirmed that a new rate-cutting cycle would kick off in September.
US Durable Goods Orders helped to keep physical production stocks bid on Monday despite a general decline in the usual darling tech sector. US Durable Goods Order in July rallied a surprising 9.9% MoM, well above the forecast 4.0% and entirely reversing the previous month’s revised -6.9% contraction.
Despite the upswing on Durable Goods Orders, some trepidation remains; excluding Transportation spending, Durable Goods Orders actually contracted -0.2% MoM, worse than the forecast 0.0% and the previous month’s tepid 0.1%, which was revised down from 0.5%.
Most of the trading week will be a quiet affair on the economic calendar. Q2 US Gross Domestic Product (GDP) figures are slated for Thursday, but are broadly expected to hold steady at 2.8% on an annualized basis. Friday could be a kicker for markets that are increasingly focused on the timing and pace of rate cuts from the Fed, with July’s US core Personal Consumption Expenditure - Price Index (PCE) inflation print set to hold steady at 0.2% MoM. The YoY PCE inflation figure is actually expected to tick upwards to 2.7% from 2.6%, but investors are confident that inflation has made enough progress towards the Fed’s 2% target that it will count as “close enough” to still keep the way open to a first rate cut on September 18.
Dow Jones news
Caterpillar (CAT) is moving higher on Monday in sharp contrast to the wider market. The NASDAQ and S&P 500 sold off on Monday morning, while Caterpillar and a number of other Dow Jones index stocks gained ground. The Dow, in fact, reached yet another all-time high at 41,420 on Monday, following last week's decent Dow performance.
Read more: Caterpillar helps Dow Jones buck tide at start of eventful week
Dow Jones price forecast
Intraday price action sees some churn on an overall quiet Monday. Bids managed to clip into a fresh all-time high above 41,400.00 to kick off the new trading week, but the overall day is still tilted toward the low side as bulls try to run on empty.
The Dow Jones has chalked in an impressive 7.9% win streak since the first week of August, climbing from a swing low to 38,382.90 to etch in a fresh all-time high at 41,419.65. Despite the impressive run that tilted entirely into the bullish side, momentum is set to drain out of the index quickly as bidders run out of runway. The Dow Jones is poised for a relief pullback towards the 50-day Exponential Moving Average (EMA) at 39,946.29.
Dow Jones daily chart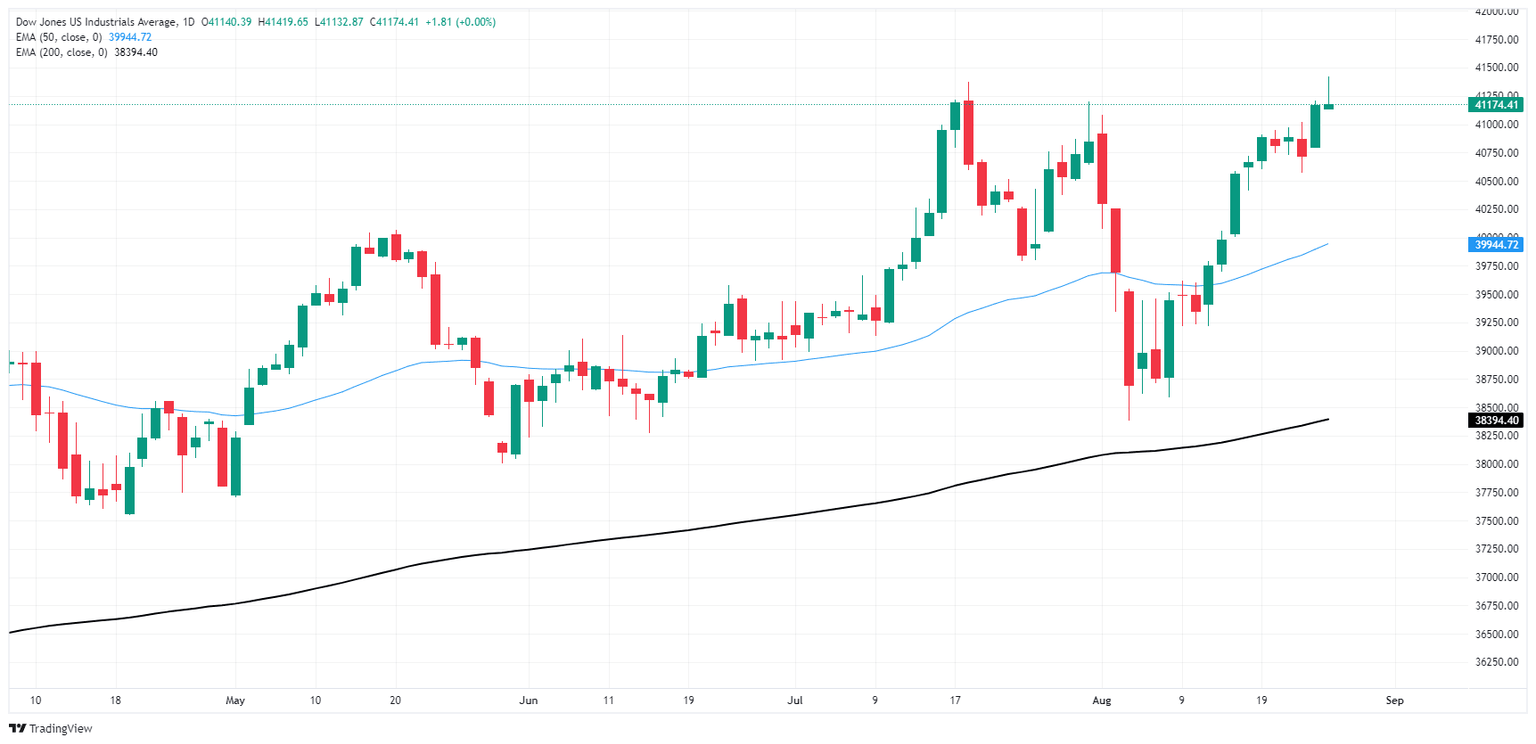
Fed FAQs
Monetary policy in the US is shaped by the Federal Reserve (Fed). The Fed has two mandates: to achieve price stability and foster full employment. Its primary tool to achieve these goals is by adjusting interest rates. When prices are rising too quickly and inflation is above the Fed’s 2% target, it raises interest rates, increasing borrowing costs throughout the economy. This results in a stronger US Dollar (USD) as it makes the US a more attractive place for international investors to park their money. When inflation falls below 2% or the Unemployment Rate is too high, the Fed may lower interest rates to encourage borrowing, which weighs on the Greenback.
The Federal Reserve (Fed) holds eight policy meetings a year, where the Federal Open Market Committee (FOMC) assesses economic conditions and makes monetary policy decisions. The FOMC is attended by twelve Fed officials – the seven members of the Board of Governors, the president of the Federal Reserve Bank of New York, and four of the remaining eleven regional Reserve Bank presidents, who serve one-year terms on a rotating basis.
In extreme situations, the Federal Reserve may resort to a policy named Quantitative Easing (QE). QE is the process by which the Fed substantially increases the flow of credit in a stuck financial system. It is a non-standard policy measure used during crises or when inflation is extremely low. It was the Fed’s weapon of choice during the Great Financial Crisis in 2008. It involves the Fed printing more Dollars and using them to buy high grade bonds from financial institutions. QE usually weakens the US Dollar.
Quantitative tightening (QT) is the reverse process of QE, whereby the Federal Reserve stops buying bonds from financial institutions and does not reinvest the principal from the bonds it holds maturing, to purchase new bonds. It is usually positive for the value of the US Dollar.
Author

Joshua Gibson
FXStreet
Joshua joins the FXStreet team as an Economics and Finance double major from Vancouver Island University with twelve years' experience as an independent trader focusing on technical analysis.