Dow Jones Industrial Average plunges 400 points as trade war fears supplant NFP print
- The Dow Jones shed 400 points after US NFP figures missed the mark.
- US consumer inflation fears rose, while their outlook deteriorated.
- US President Donald Trump puts tariffs back on the board.

The Dow Jones Industrial Average (DJIA) took a fresh beating on Friday after Nonfarm Payrolls (NFP) missed market forecasts, and the University of Michigan’s (UoM) Consumer Sentiment Index showed a sharp downturn in consumers’ overall economic outlook. United States (US) President Donald Trump also put his long-awaited trade war back on the table, dropping hints of things to come with threats of reciprocal tariffs on countries that have their own tariffs on US goods.
US NFP preliminary payrolls came in softer than expected in January, adding a net 143K new worker positions over the month, even lower than the forecast 170K. Still, it wasn’t all bad news on the labor front: December’s NFP print was revised significantly higher to 307K, and the Unemployment Rate ticked back down to 4.0% from 4.1%.
The UoM Consumer Sentiment Index for January contracted sharply to a new seven-month low of 67.8 as US consumers turned increasingly gloomy on their economic outlook. The sentiment index’s last score was 71.1. According to the UoM’s comprehensive survey results, US consumers are also battling renewed inflation fears with 12-month inflation expectations jumping to 4.3% versus the last print of 3.3%. Higher inflation expectations are taking root, with 5-year inflation expectations also ticking higher to 3.3% from 3.2%.
US President Donald Trump hit markets with a fresh round of rambling tariff threats, just to keep investors and markets on their toes and remind everyone that his plan is still to address the US’ debt problems with import fees on his own citizens. The President signed an executive order to begin preparing for de minimis, or minuscule, tariffs on China that are largely symbolic in nature, but promised via social media that he is preparing a wider package of reciprocal tariffs on “many countries”.
Dow Jones news
Market sentiment whipsawed on Friday, churning in both directions before getting jolted lower by fresh trade war headlines. Most of the Dow Jones equity board has turned lower, with thin gains getting overshadowed by steep losses from Amazon (AMZN).
Amazon posted better-than-expected earnings and revenue in Q4, but the megacompany also cautioned that headwinds may be on the horizon. It lowered its forward guidance for Q1 and sent investors running for the hills. Amazon's stock dropped 4% on Friday, sinking below $230 per share.
Dow Jones price forecast
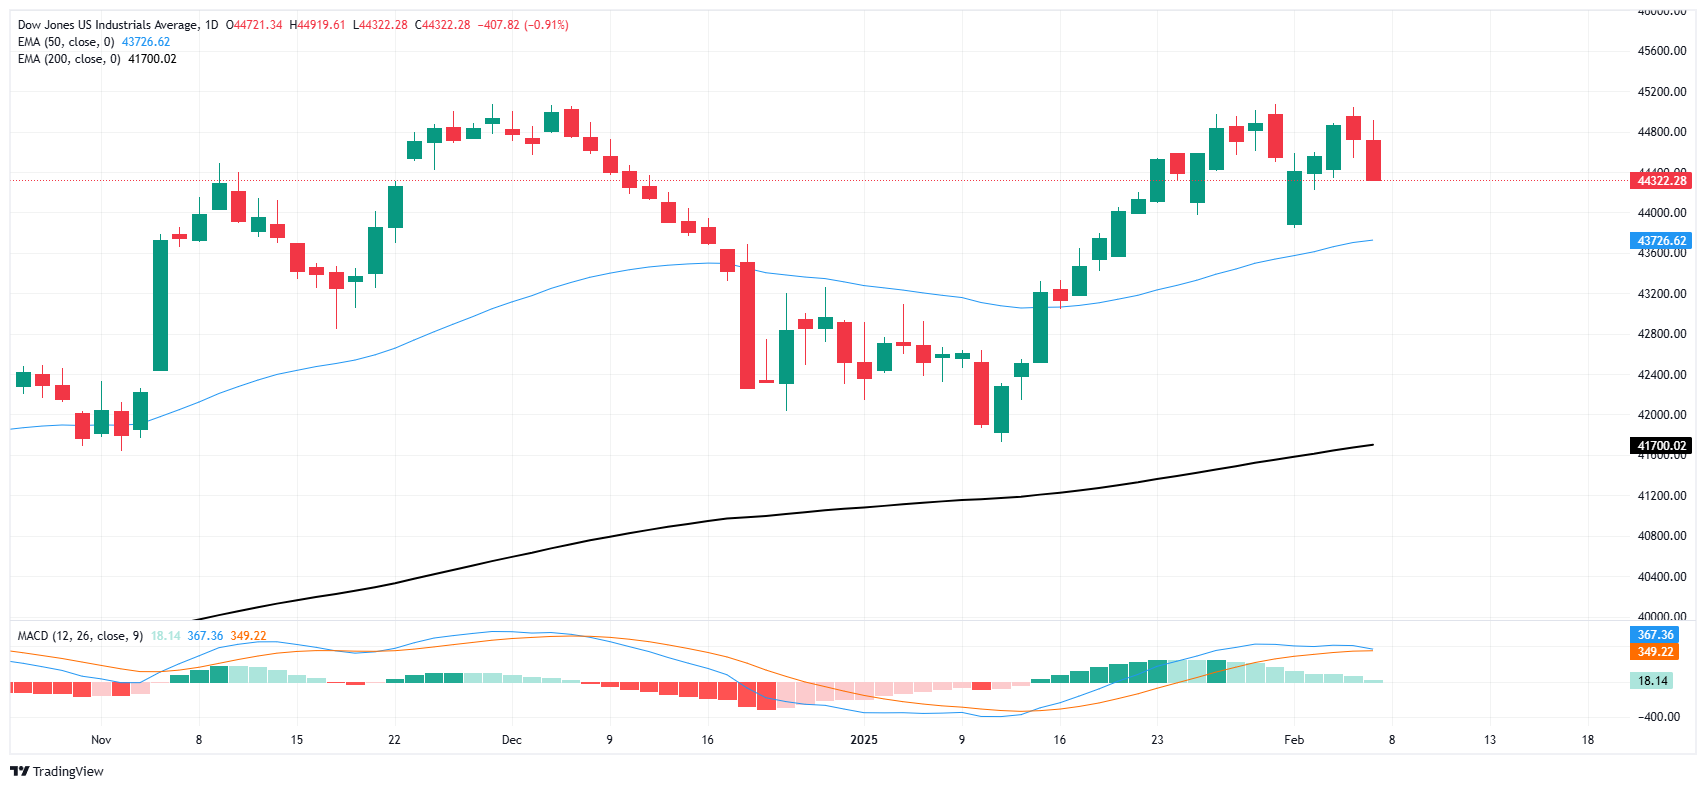
The Dow Jones has extended into a second straight down day, shedding 400 points and falling back to the 44,300 region. The 44,000 handle is back in view, and the index is down over 1.5% from another failed attempt to muscle the major equity index over the 45,000 key price level. The immediate target for a bearish retracement is parked at the 50-day Exponential Moving Average (EMA) near 43,730.
Dow Jones daily chart
Economic Indicator
Nonfarm Payrolls
The Nonfarm Payrolls release presents the number of new jobs created in the US during the previous month in all non-agricultural businesses; it is released by the US Bureau of Labor Statistics (BLS). The monthly changes in payrolls can be extremely volatile. The number is also subject to strong reviews, which can also trigger volatility in the Forex board. Generally speaking, a high reading is seen as bullish for the US Dollar (USD), while a low reading is seen as bearish, although previous months' reviews and the Unemployment Rate are as relevant as the headline figure. The market's reaction, therefore, depends on how the market assesses all the data contained in the BLS report as a whole.
Read more.Last release: Fri Feb 07, 2025 13:30
Frequency: Monthly
Actual: 143K
Consensus: 170K
Previous: 256K
Source: US Bureau of Labor Statistics
America’s monthly jobs report is considered the most important economic indicator for forex traders. Released on the first Friday following the reported month, the change in the number of positions is closely correlated with the overall performance of the economy and is monitored by policymakers. Full employment is one of the Federal Reserve’s mandates and it considers developments in the labor market when setting its policies, thus impacting currencies. Despite several leading indicators shaping estimates, Nonfarm Payrolls tend to surprise markets and trigger substantial volatility. Actual figures beating the consensus tend to be USD bullish.
Author

Joshua Gibson
FXStreet
Joshua joins the FXStreet team as an Economics and Finance double major from Vancouver Island University with twelve years' experience as an independent trader focusing on technical analysis.


