Dow Jones Elliott Wave technical analysis [Video]
![Dow Jones Elliott Wave technical analysis [Video]](https://editorial.fxstreet.com/images/Markets/Equities/DowJones/DowJones_frontbuilding_XtraLarge.jpg)
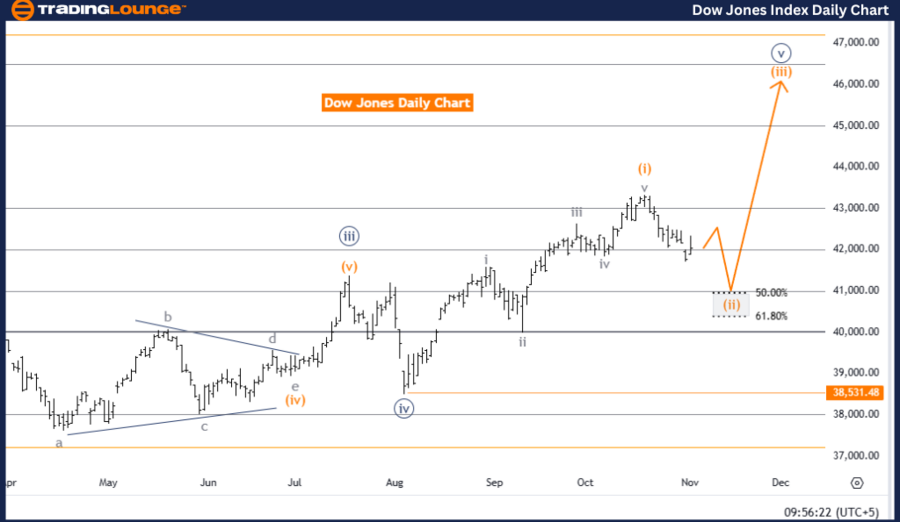
DOW JONES - DJI Elliott Wave Analysis Trading Lounge Day Chart
DJI Elliott Wave technical analysis
-
Function: Counter Trend.
-
Mode: Corrective.
-
Structure: Orange Wave 2.
-
Position: Navy Blue Wave 5.
-
Direction next higher degrees: Orange Wave 3.
Details: The Elliott Wave analysis on the Dow Jones (DJI) daily chart indicates a counter-trend move within a corrective wave structure. This phase highlights Orange Wave 2, marking a corrective stage after the completion of the prior impulsive Orange Wave 1. Currently positioned within Navy Blue Wave 5, this phase suggests that Wave 2 is underway, creating a temporary pause or retracement within the broader upward trend.
The next projected phase, Orange Wave 3, is anticipated to continue the primary trend upwards once Orange Wave 2 completes. According to Elliott Wave Theory, such corrective phases—like Orange Wave 2—serve as consolidation or pullback opportunities, establishing a foundation before resuming the main trend direction.
An invalidation level is set at 38,531.48, marking a critical threshold for this wave structure. Should the price action fall below this level, it would invalidate the current wave pattern and potentially indicate a shift from the expected corrective wave. However, as long as the price remains above this threshold, the wave count is valid, suggesting a likely continuation into Orange Wave 3 upon Orange Wave 2’s completion.
This setup implies that once Orange Wave 2 ends, the primary trend should resume upward, aligning with the anticipated progression into Orange Wave 3. The current wave count supports a bullish outlook beyond this corrective stage, provided the invalidation level is maintained. This structure points to a temporary pause before the market may continue its upward trend, completing the transition into the impulsive structure anticipated with Orange Wave 3.
DJI day chart
DJI Elliott Wave technical analysis
-
Function: Counter Trend.
-
Mode: Corrective.
-
Structure: Orange Wave 2.
-
Position: Navy Blue Wave 5.
-
Direction next higher degrees: Orange Wave 3.
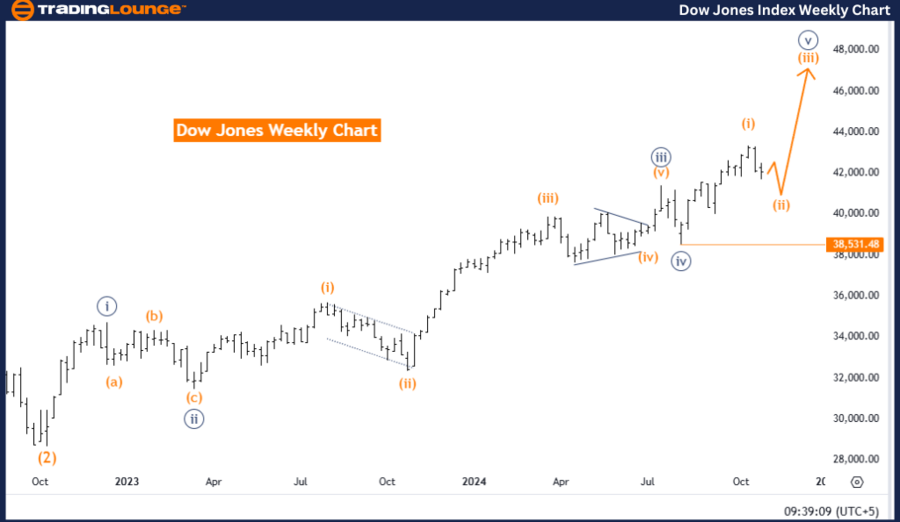
Details: The weekly Elliott Wave analysis of the Dow Jones (DJI) reveals a counter-trend corrective phase within Orange Wave 2. This stage follows the completion of Orange Wave 1, signaling a temporary retracement within the ongoing upward trend. Positioned within Navy Blue Wave 5, this wave reflects that Orange Wave 2 is currently active, representing a correction within the larger trend.
Upon completion of Orange Wave 2, expectations are set for the index to transition into Orange Wave 3, resuming the primary bullish trajectory. This anticipated Wave 3 suggests an upward move after the corrective retracement of Wave 2. In Elliott Wave Theory, corrective waves like Orange Wave 2 often act as consolidation periods, allowing the market to build momentum before resuming its advance.
The invalidation level for this wave structure is established at 38,531.48. Should prices dip below this level, it would invalidate the current wave count and potentially indicate a shift in the expected movement. However, as long as prices remain above this threshold, the structure supports the forecast of a continuation into Orange Wave 3 following Orange Wave 2's conclusion. This level serves as a checkpoint to affirm the wave count and the market's overall direction, sustaining the integrity of the projected corrective and impulsive phases.
In summary, this analysis highlights a temporary corrective phase within the broader upward trend. Orange Wave 2 marks a pause before the likely progression into the impulsive Orange Wave 3. This corrective structure provides the market with an opportunity to stabilize before resuming its upward trajectory, assuming prices stay above the invalidation level. Overall, the wave setup maintains a bullish outlook for the longer term, with the market expected to transition back into the primary trend upon completing this correction.
DJI weekly chart
Dow Jones Elliott Wave technical analysis [Video]
Author

Peter Mathers
TradingLounge
Peter Mathers started actively trading in 1982. He began his career at Hoei and Shoin, a Japanese futures trading company.


