Dow Jones Elliott Wave technical analysis [Video]
![Dow Jones Elliott Wave technical analysis [Video]](https://editorial.fxstreet.com/images/Markets/Equities/DowJones/DowJones_frontbuilding_XtraLarge.jpg)
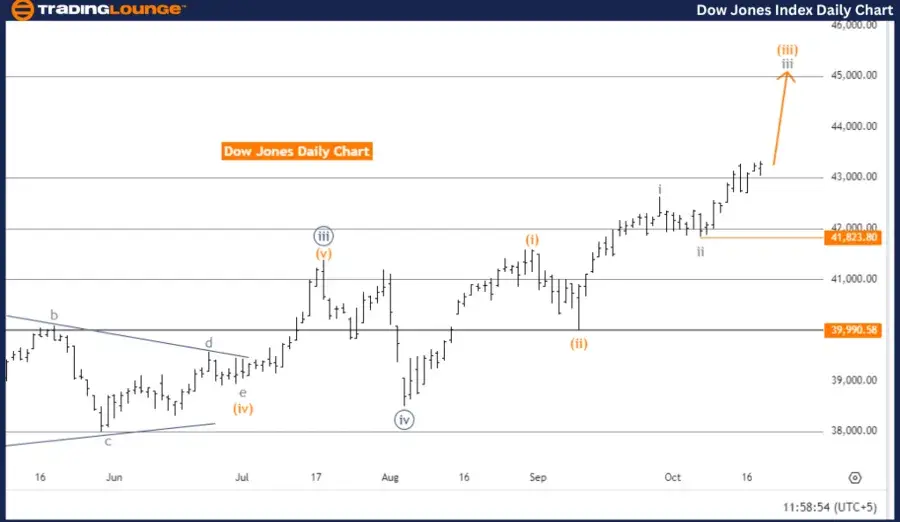
DOW JONES – DJI Elliott Wave Analysis Trading Lounge Day Chart.
Dow Jones – DJI Elliott Wave technical analysis
-
Function: Bullish Trend.
-
Mode: Impulsive.
-
Structure: Gray Wave 3.
-
Position: Orange Wave 3.
-
Direction next lower degrees: Gray Wave 4.
-
Details: Gray Wave 2 appears completed, with Gray Wave 3 currently in play.
-
Wave cancel invalid level: 41,823.80.
The Elliott Wave analysis for the Dow Jones (DJI) on the daily chart indicates that the market is currently in a bullish trend, operating in impulsive mode. The main structure being observed is Gray Wave 3, which signifies the continuation of the market's upward momentum. This bullish phase is expected to extend as part of the broader wave pattern.
Currently, the market is positioned within Orange Wave 3, a component of the larger Gray Wave 3. This wave suggests a strong upward movement, with the establishment of higher highs and higher lows. The preceding Gray Wave 2 has likely been completed, paving the way for the current rise in Gray Wave 3. The market is expected to continue its advance within this impulsive phase.
The analysis also points to Gray Wave 4 as the next phase in lower degrees, which will follow the completion of the current Gray Wave 3. This potential corrective wave (Gray Wave 4) is likely to represent a pullback or consolidation before the bullish trend resumes.
Traders are monitoring the wave cancellation level at 41,823.80. Should the price drop below this level, the current wave structure would be invalidated, requiring a reassessment of the Elliott Wave count. Until this level is breached, the bullish trend is expected to persist as Gray Wave 3 continues to unfold.
Summary: The Dow Jones daily chart reflects a bullish trend, with the market currently in Gray Wave 3, specifically within Orange Wave 3. The completion of Gray Wave 2 has led to the present impulsive upward movement, with Gray Wave 4 expected next. The wave cancellation level is 41,823.80.
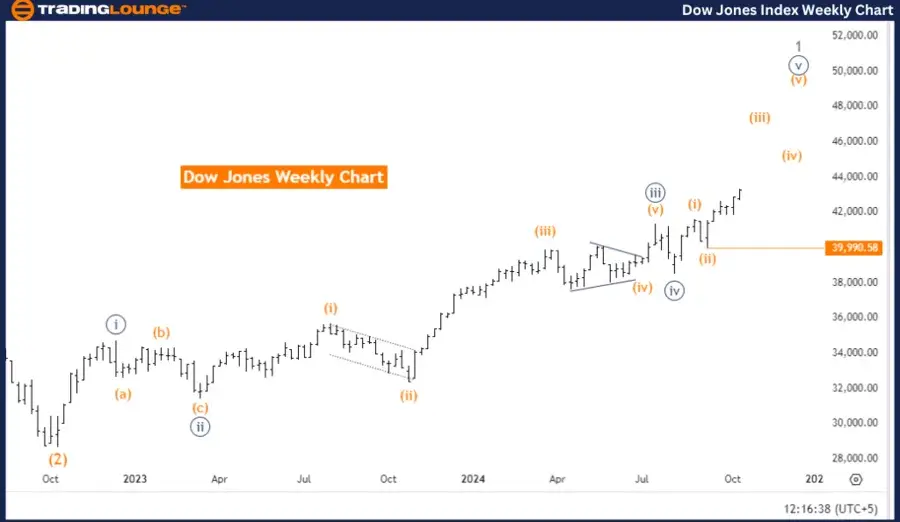
DOW JONES – DJI Elliott Wave Analysis Trading Lounge Weekly Chart
Dow Jones – DJI Elliott Wave technical analysis
-
Function: Bullish Trend.
-
Mode: Impulsive.
-
Structure: Orange Wave 3.
-
Position: Navy Blue Wave 5.
-
Direction next lower degrees: Orange Wave 4.
-
Details: Orange Wave 2 appears completed, with Orange Wave 3 now in play.
-
Wave cancel invalid level: 39,990.58.
The Elliott Wave analysis for the Dow Jones (DJI) on the weekly chart indicates a bullish trend with an impulsive wave structure. The primary wave being monitored is Orange Wave 3, reflecting continued upward momentum in the market. This impulsive movement signals strong buying pressure and is likely to push prices higher as it progresses.
Currently, the market is positioned within Navy Blue Wave 5, which forms part of the broader Orange Wave 3 structure. The completion of Orange Wave 2 suggests that the corrective phase has concluded, and the bullish trend has resumed with Orange Wave 3 now underway. This wave is expected to lead the market higher, continuing the overall positive sentiment.
Following the completion of Orange Wave 3, the next anticipated phase is Orange Wave 4, which could bring a corrective pullback or consolidation before the upward trend resumes. However, the current focus remains on the development of Orange Wave 3, which is driving the bullish movement.
The wave cancellation level is set at 39,990.58. If the market falls below this level, the current wave count would be invalidated, requiring a reassessment of the analysis. Until then, the expectation is for the bullish trend to continue, with Orange Wave 3 pushing the market higher.
Summary: The Dow Jones weekly chart reflects a bullish trend, with the market positioned in Navy Blue Wave 5 within the broader Orange Wave 3 structure. The completion of Orange Wave 2 has led to the current rise in Orange Wave 3, and the next phase is expected to be Orange Wave 4. The wave cancellation level to monitor is 39,990.58.
Technical analyst: Malik Awais.
Dow Jones – DJI Elliott Wave technical analysis [Video]
Author

Peter Mathers
TradingLounge
Peter Mathers started actively trading in 1982. He began his career at Hoei and Shoin, a Japanese futures trading company.


