Dow Jones (DJI) Elliott Wave technical analysis [Video]
![Dow Jones (DJI) Elliott Wave technical analysis [Video]](https://editorial.fxstreet.com/images/Markets/Equities/DowJones/DowJones_frontbuilding_XtraLarge.jpg)
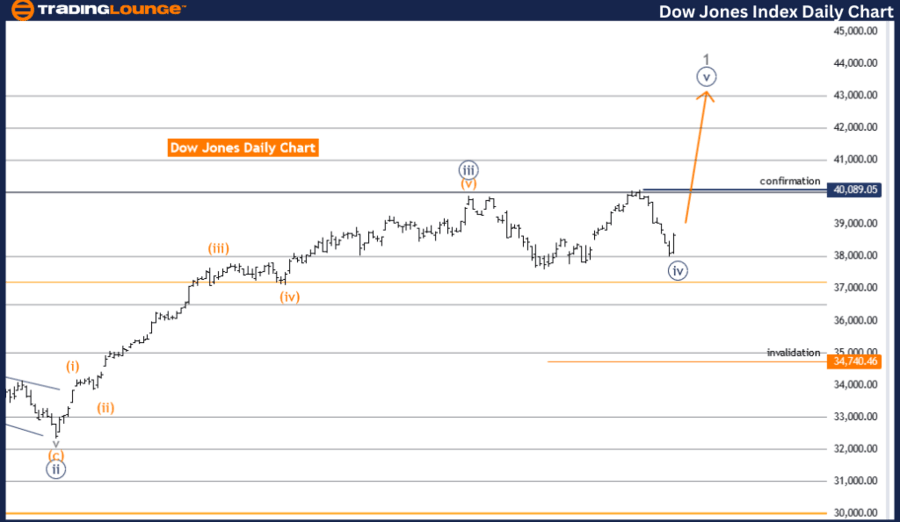
DOW JONES- DJI Elliott Wave Analysis Trading Lounge Day Chart,
DJI Elliott Wave technical analysis
Function: Trend.
Mode: Impulsive.
Structure: Navy blue wave 5.
Position: gray wave 1.
Direction next higher degrees: Navy blue wave 5 (may started).
Details: Navy blue wave 4 may be completed now looking for navy blue wave 5 of 1.
Wave cancel invalid level: 34740.46.
The DOW JONES- DJI Elliott Wave Analysis for the day chart focuses on the market's current trend using the Elliott Wave Theory. This analysis categorizes the trend as impulsive, indicating a decisive movement in one direction. The primary wave structure under consideration is navy blue wave 5, which is positioned within gray wave 1. This suggests that the market is in the initial phase of a potentially significant upward trend.
The analysis details that navy blue wave 4 might have been completed, implying that the market has concluded a corrective phase and is now poised to enter navy blue wave 5. This phase is expected to continue the upward momentum, indicating further bullish behavior in the market.
The direction for the next higher degrees points towards navy blue wave 5, which may have just started. This implies that the market could sustain its upward trend for a considerable period, reflecting the robust nature of the impulsive wave structure currently being observed.
A crucial aspect of this analysis is the wave cancel invalid level, set at 34740.46. This level acts as a critical threshold, which if breached, would invalidate the current wave count and necessitate a reassessment of the wave structure. The market must stay above this level to maintain the validity of the current Elliott Wave count and for the expected trends to unfold as predicted.
In summary, the DOW JONES- DJI Elliott Wave Analysis on the day chart highlights a strong, impulsive trend within navy blue wave 5, following the completion of navy blue wave 4. The market is anticipated to continue its upward trajectory, with the wave cancel invalid level at 34740.46 serving as a key point for maintaining the current wave count's validity. This analysis provides valuable insights for traders utilizing Elliott Wave Theory to guide their strategic decisions.
DOW JONES- DJI Elliott Wave Analysis Trading Lounge Weekly Chart.
DJI Elliott Wave technical analysis
Function: Trend.
Mode: impulsive.
Structure: navy blue wave 5.
Position: gray wave 1.
Direction next higher degrees: navy blue wave 5 (may started).
Details: navy blue wave 4 may be completed now looking for navy blue wave 5 of 1.
Wave cancel invalid level: 34740.46.
The DOW JONES- DJI Elliott Wave Analysis for the weekly chart presents an evaluation of the market trend based on Elliott Wave Theory. The analysis identifies the trend as impulsive, which suggests a strong, unidirectional movement. The primary wave structure under consideration is navy blue wave 5, situated within gray wave 1. This indicates that the market is in the early stages of a significant upward trend.
The key detail highlighted is that navy blue wave 4 might have reached completion. This completion marks the end of a corrective phase and suggests that the market is now transitioning into navy blue wave 5. This wave is expected to continue the upward movement, reflecting a bullish outlook.
The direction for the next higher degrees is oriented towards navy blue wave 5, which may have just commenced. This points to a sustained upward trend, suggesting that the market will likely experience continued growth. The impulsive nature of the wave structure supports this optimistic forecast.
A critical aspect of the analysis is the wave cancel invalid level, which is set at 34740.46. This level serves as a pivotal threshold. If the market falls below this point, it would invalidate the current wave count and necessitate a reevaluation of the wave structure. Maintaining levels above this threshold is crucial for the validity of the current analysis and the anticipated market trends.
In essence, the DOW JONES- DJI Elliott Wave Analysis on the weekly chart underscores a strong, impulsive trend within navy blue wave 5, following the likely completion of navy blue wave 4. The market is expected to continue its upward trajectory, with the wave cancel invalid level at 34740.46 being a key marker for maintaining the current wave count's validity. This analysis offers valuable insights for traders who utilize Elliott Wave Theory to inform their trading strategies, highlighting the potential for ongoing bullish momentum.
Technical Analyst: Malik Awais
DJI Elliott Wave technical analysis [Video]
Author

Peter Mathers
TradingLounge
Peter Mathers started actively trading in 1982. He began his career at Hoei and Shoin, a Japanese futures trading company.


