|

Dow Jones and Nasdaq 100 on the edge: Key support levels tested as pullback looms

Critical support levels in focus as Dow Jones and Nasdaq 100 signal potential market reversal.

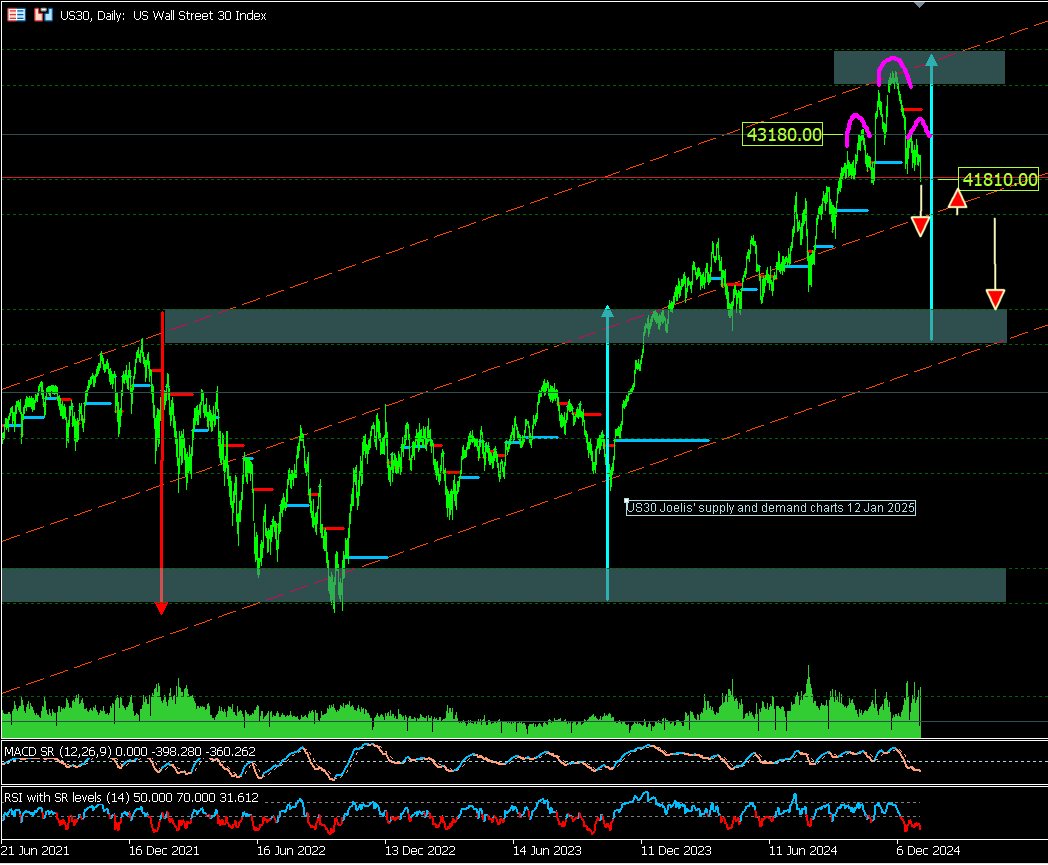
The Dow Jones Industrial Average stands at a pivotal moment, signalling a potential pullback. Friday's close near the critical 41,810 support level, tested repeatedly since September 2024, underscores its importance. A breach below this level could activate the reversal pattern seen on the chart, driving prices to the middle of the 4-year price channel. Conversely, holding above 41,810 opens the door for another attempt to retest the 43,180 resistance, which has already failed twice, as noted in the December 26 analysis.

Dow Jones price chart

Nasdaq 100 price chart

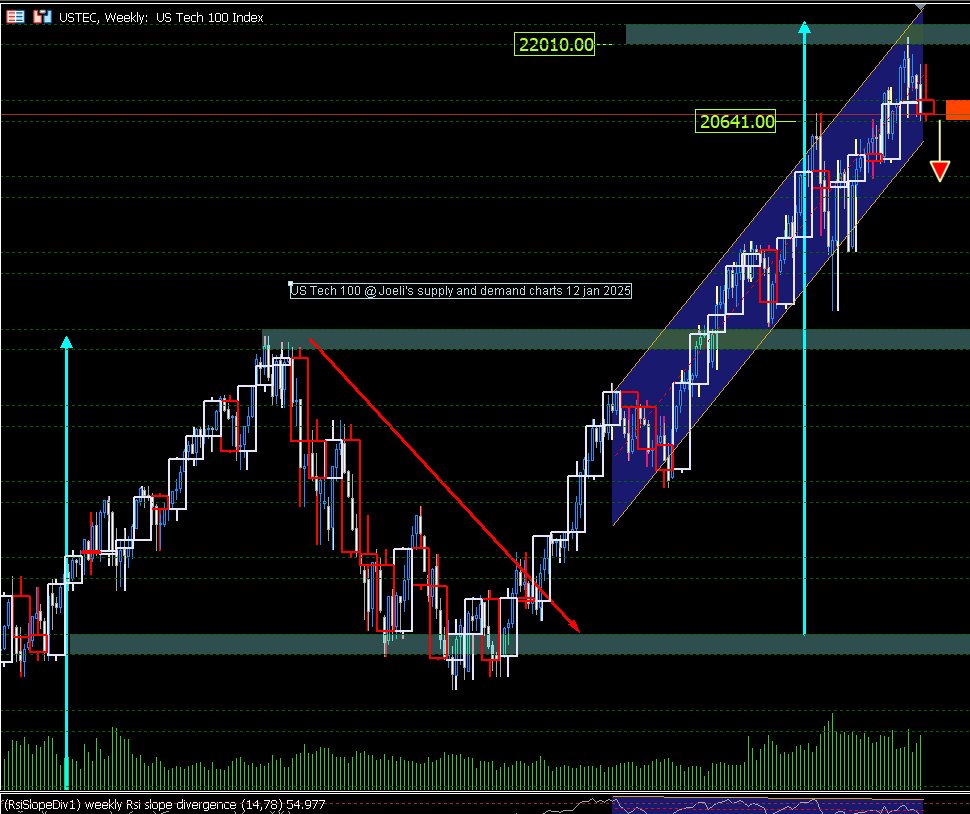
Similarly, the Nasdaq 100 is walking a fine line, hovering around the 20,641 major support zone in the weekly time frame. The recent two weeks of poor performance and signs of price exhaustion call for heightened vigilance. A breakdown at this critical level could spark a deeper correction.

Traders and investors should stay alert and prepared, as these key levels will shape the market's direction in the coming weeks. Monitoring price action closely is paramount to navigating potential volatility.

Author

Denis Joeli Fatiaki

Denis Joeli Fatiaki

Independent Analyst

Denis Joeli Fatiaki possesses over a decade of extensive experience as a multi-asset trader and Market Strategist.

More from Denis Joeli Fatiaki
Share:

Editor's Picks

EUR/USD: Breakdown below trading range support near 1.1770 comes into play

The EUR/USD pair opens with a bearish gap at the start of a new week as the US-Iran war-led global flight to safety boosts the US Dollar. Spot prices, however, lack follow-through selling and manage to hold above mid-1.1700s during the Asian session.

GBP/USD targets 1.3500 barrier near moving averages

GBP/USD rebounds from the daily losses, trading around 1.3450 during the Asian hours on Monday. The technical analysis of the daily chart indicates an ongoing bearish bias, as the pair trades within a descending channel pattern.

Gold jumps over 2% toward $5,400 after US, Israel attack Iran

Gold is on fire at the start of the week, a widely expected move, as investors seek harbor in the traditional store of value, following the continued US and Israel attacks on Iran. The bright metal opened with a bullish gap of about $17 and rallied toward the $5,400 level as Asian traders hit their desks and reacted negatively to the weekend news of the Middle East conflict, rushing for cover in Gold.

Iran escalation: Quick thoughts on markets

Markets are likely to open the week with risk-off, with declines led by airlines, cyclicals and trade-exposed names, while energy, defense and “strategic” sectors may be relatively steadier.

Crisis in the Middle East: The market reaction

A primer on how markets will open on Monday, and why geopolitical risk may not be easily absorbed by financial markets this time around. Geopolitics and events between Iran, the US and the wider Middle East will dominate financial markets on Monday. The situation has continued to escalate as we move through Sunday. 

Starknet unveils strkBTC, shielded Bitcoin transactions on Ethereum Layer 2

Starknet, the Ethereum Layer 2 network developed by StarkWare, today announced strkBTC, a wrapped Bitcoin asset that introduces optional shielding while preserving full DeFi composability.