Dow Futures (YM) extends bullish sequence from zigzag pullback
About the zigzag structure
The zigzag structure is one of the three core corrective patterns explained in the Elliott Wave theory. The other two are the Flat and Triangle structures. Typically, a zigzag structure is counter trend i.e. it develops against the prevailing market direction. Structurally, it’s a 3-swing structure – ABC structure.
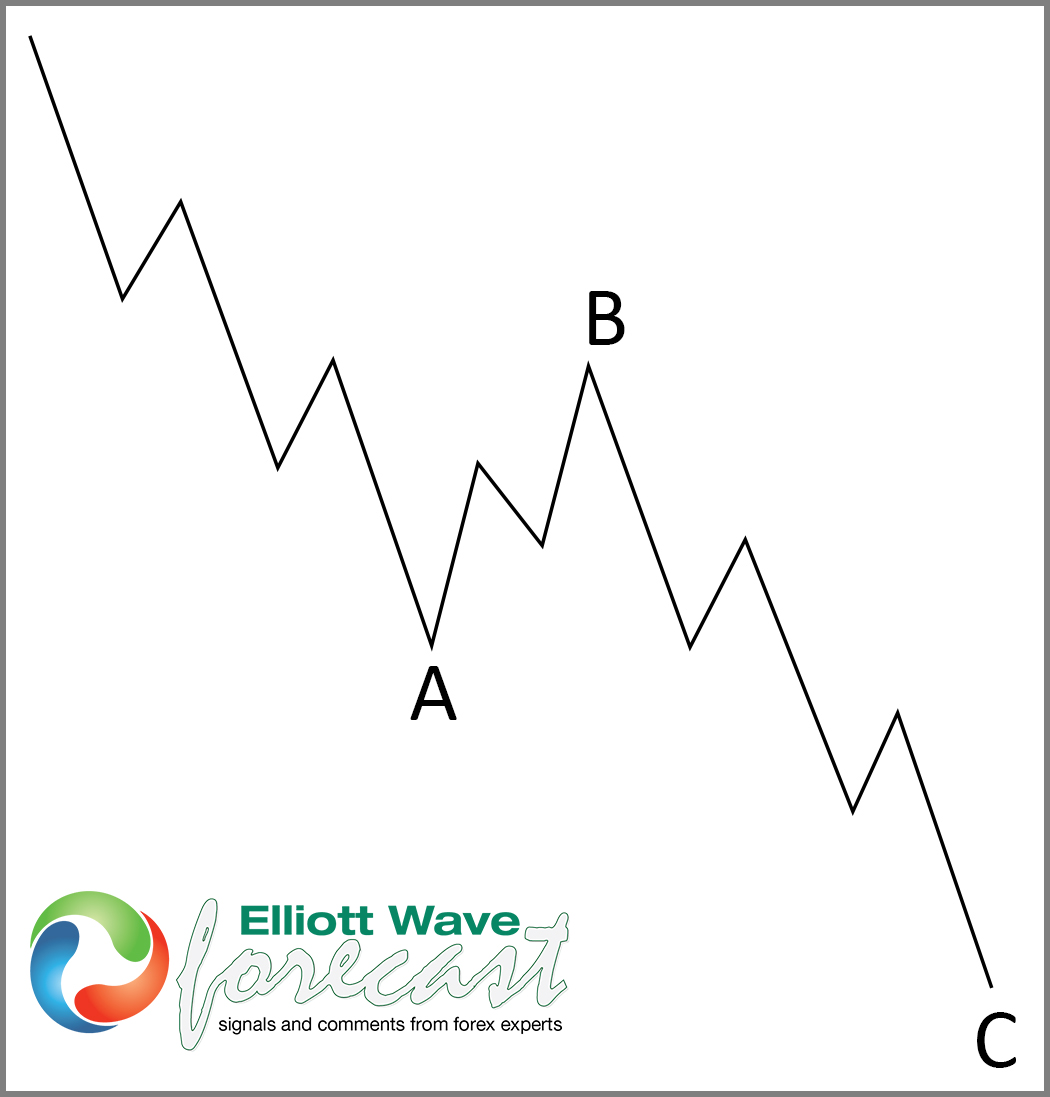
Wave A is a 5-wave structure – could either be an impulse or a diagonal. Meanwhile, wave B could be any of corrective structures – zigzag, flat or triangle. Lastly, wave C can also be an impulse or diagonal. Meanwhile, while wave A and B can both be impulse, it’s very rare seeing both being a diagonal. Here are some other useful rules/guidelines:
1. Wave B does not correct more than 100% of wave A
2. Wave C breaks the low of wave A in a bearish structure and the high of wave A in a bullish structure
3. Wave C often extends to 100-123% of wave A from wave B. While it could extend more than 123.6%, it rarely extends more than 161.8% of wave A
At Elliottwave-forecast, the zigzag structure is one of our ‘bread and butter’ structure. We like buying at the 100% of wave A from B in a bearish zigzag structure along a bullish sequence. On the other hand, we like selling at the 100% of wave A from B in a bullish zigzag along a bearish sequence. While we like trading at the 100%, we like putting stop at the 161.8%. Let’s check a case study – a recent $YM_F setup.
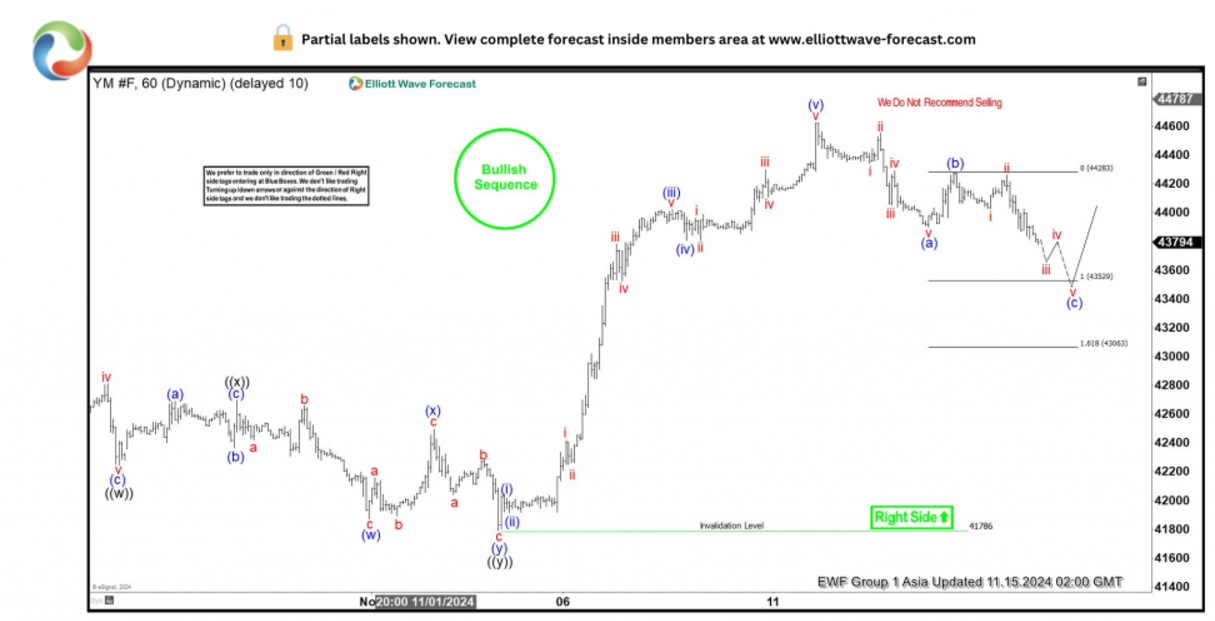
Dow Futures (YM) chart – 11.15.2024
Since August 2024, the Dow futures (YM) resumed the larger bullish sequence from September 2022. In the short term, our intention was to buy pullbacks when they complete a 3-swing (zigzag) or a 7-swing (double zigzag) structure. A double zigzag pullback finished in early November and the Dow rallied sharply. However, another pullback would soon follow toward mid-November. Indeed, we identified a 3-swing structure (zigzag) which we expected to finish at the 43529-43063 Fibonacci zone. We then notified members with the chart below.
Dow Futures (YM) chart – 11.28.2024
We shared the chart below on 28th November 2024 – barely two weeks later. The Dow reached the extreme as we expected having completed a zigzag structure. Several days after, the index rallied for another impulse structure. The chart also shows another pullback emerging. This is a textbook example of a zigzag structure in a bullish sequence.
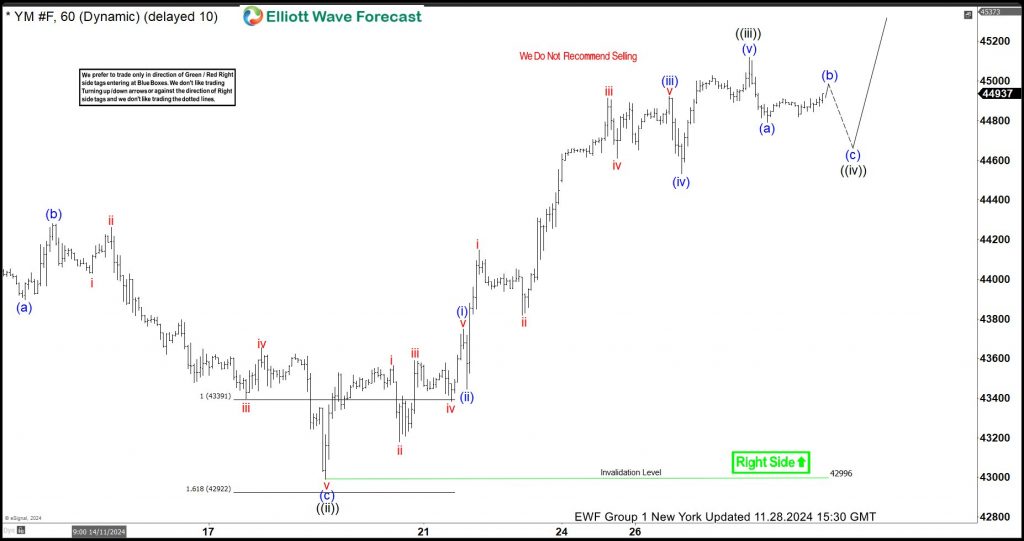
While the bullish sequence persists, buyers will continue to wait for pullbacks and buy at the extreme of a 3 or 7 swing structure.
Author

Elliott Wave Forecast Team
ElliottWave-Forecast.com


