Docusign Stock: DOCU bulls edge toward previous resistance


  • Since June 3 earnings, DOCU stock has soared.
  • Docusign shares face critical resistance between $262.25 and $268.80.
  • The e-signature titan stock is flat in Tuesday's premarket.

After a parabolic rise that saw Docusign (NASDAQ: DOCU) stock break out of its YTD descending price channel last week, the e-signature titan is approaching plenty of resistance between $262.65 and $268.80. Shares of Docusign closed at $257.26 on Monday, June 14.

Docusign stock price: Can DOCU continue the earnings bounce?

Docusign had been suffering from quite the seasonal decline alongside other top-40 growth favourites. Since the close at $265.16 on February 19, DOCU fell into a descending channel that carried it downhill to a low of $179.49 in mid-May, a decline of more than 32%. The DOCU share price was saved by June 3 earnings that provided a nearly 60% non-GAAP EPS beat to entice the market back into buy mode. 

The stock popped almost 20% during the following session and has registered green daily candlesticks for six of the seven sessions post-earnings. DOCU is at the time of writing near the top end of a supply zone that extends from $250 to $260. Above $260, the stock will face headwinds between $262.65 and $268.80 where it faced trouble back in January and February, as well as September of 2020. And if it makes its way through this jungle, then only the $290.23 high from September 2 of last year stands in its way.

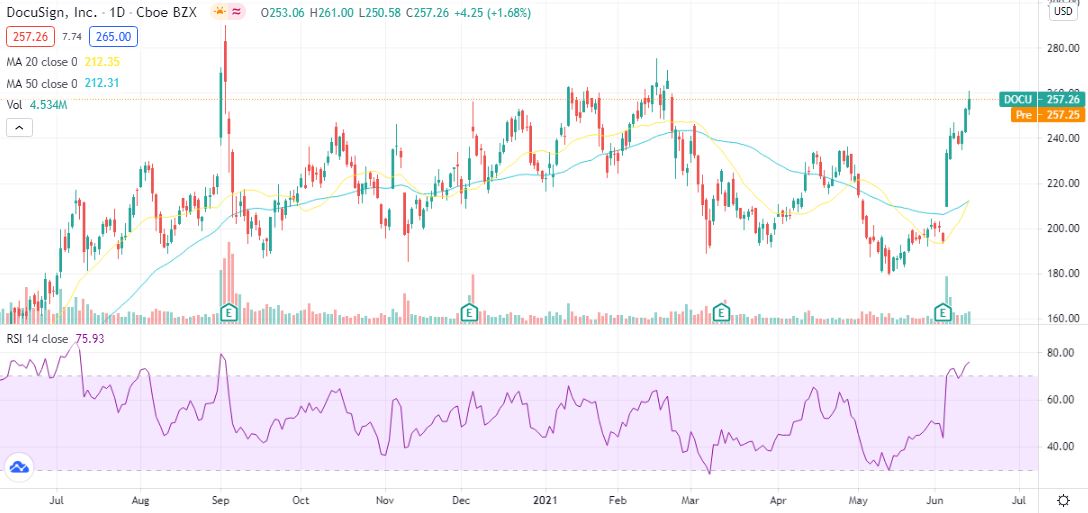
If DOCU stock corrects off the supply zone above $260, then support can be found near $234 – the double top from April. Below here, there should also be support at $212.31, where the 20-day Simple Moving Average (SMA) crossed above the 50-day SMA. Since the Relative Strength Index (RSI) is at 76, it would seem that a correction is likely. The last time the RSI was in overbought territory was that high from September 2, after which it experienced an extreme pullback.

At a market capitalization of $50 billion, DOCU is trading at about 25 times fiscal 2021 revenue guidance. Analyst consensus, however, thinks the stock is still undervalued with an average price target of $272.61.


Share: Feed news

Information on these pages contains forward-looking statements that involve risks and uncertainties. Markets and instruments profiled on this page are for informational purposes only and should not in any way come across as a recommendation to buy or sell in these assets. You should do your own thorough research before making any investment decisions. FXStreet does not in any way guarantee that this information is free from mistakes, errors, or material misstatements. It also does not guarantee that this information is of a timely nature. Investing in Open Markets involves a great deal of risk, including the loss of all or a portion of your investment, as well as emotional distress. All risks, losses and costs associated with investing, including total loss of principal, are your responsibility. The views and opinions expressed in this article are those of the authors and do not necessarily reflect the official policy or position of FXStreet nor its advertisers. The author will not be held responsible for information that is found at the end of links posted on this page.

If not otherwise explicitly mentioned in the body of the article, at the time of writing, the author has no position in any stock mentioned in this article and no business relationship with any company mentioned. The author has not received compensation for writing this article, other than from FXStreet.

FXStreet and the author do not provide personalized recommendations. The author makes no representations as to the accuracy, completeness, or suitability of this information. FXStreet and the author will not be liable for any errors, omissions or any losses, injuries or damages arising from this information and its display or use. Errors and omissions excepted.

The author and FXStreet are not registered investment advisors and nothing in this article is intended to be investment advice.

Recommended content


Recommended content

Editors’ Picks

EUR/USD climbs above 1.0900, looks to post weekly gains

EUR/USD climbs above 1.0900, looks to post weekly gains

EUR/USD gathers bullish momentum and trades above 1.0900 in the American session on Friday, looking to end the week in positive territory. The US Dollar remains under strong selling pressure following the disappointing jobs data, helping the pair push higher.

EUR/USD News

GBP/USD clings to daily gains near 1.2800 after weak US jobs data

GBP/USD clings to daily gains near 1.2800 after weak US jobs data

GBP/USD clings to daily gains at around 1.2800 in the second half of the day on Friday. Nonfarm Payrolls in the US rose by 114,000 in July. This reading missed the market expectation of 175,000 by a wide margin and triggered a USD selloff.

GBP/USD News

Gold pulls away from daily highs, holds above $2,420

Gold pulls away from daily highs, holds above $2,420

After coming within a touching distance of a new all-time high near $2,480 with the immediate reaction to disappointing US labor market data on Friday, Gold reversed its direction and declined below $2,420. Profit-taking ahead of the weekend might be weighing on XAU/USD.

Gold News

Bitcoin bounces off from the ascending trendline

Bitcoin bounces off from the ascending trendline

Bitcoin and Ethereum have retested their key support levels, with a break below these levels potentially signaling a bearish trend ahead. At the same time, Ripple shows resilience and could rally in the coming days after testing its key support level.

Read more

Week ahead – RBA and BoJ summary of opinions take center stage

Week ahead – RBA and BoJ summary of opinions take center stage

RBA decides on policy as hike bets disappear. BoJ Summary of Opinions awaited for more hike hints. After Fed, Dollar turns to ISM non-manufacturing PMI. New Zealand and Canada jobs data also on tap.

Read more

Forex MAJORS

Cryptocurrencies

Signatures