|

Do not buy NIO stock until it breaks October 2022 low

Nio Inc. (NIO) is a Chinese multinational automobile manufacturer headquartered in Shanghai, specializing in designing and developing electric vehicles. The company develops battery- swapping stations for its vehicles, as an alternative to conventional charging stations. The company has raised over $5 billions from investors. In 2021, it plans to expand to 25 different countries and regions by 2025.

NIO daily chart December 2022

NIO

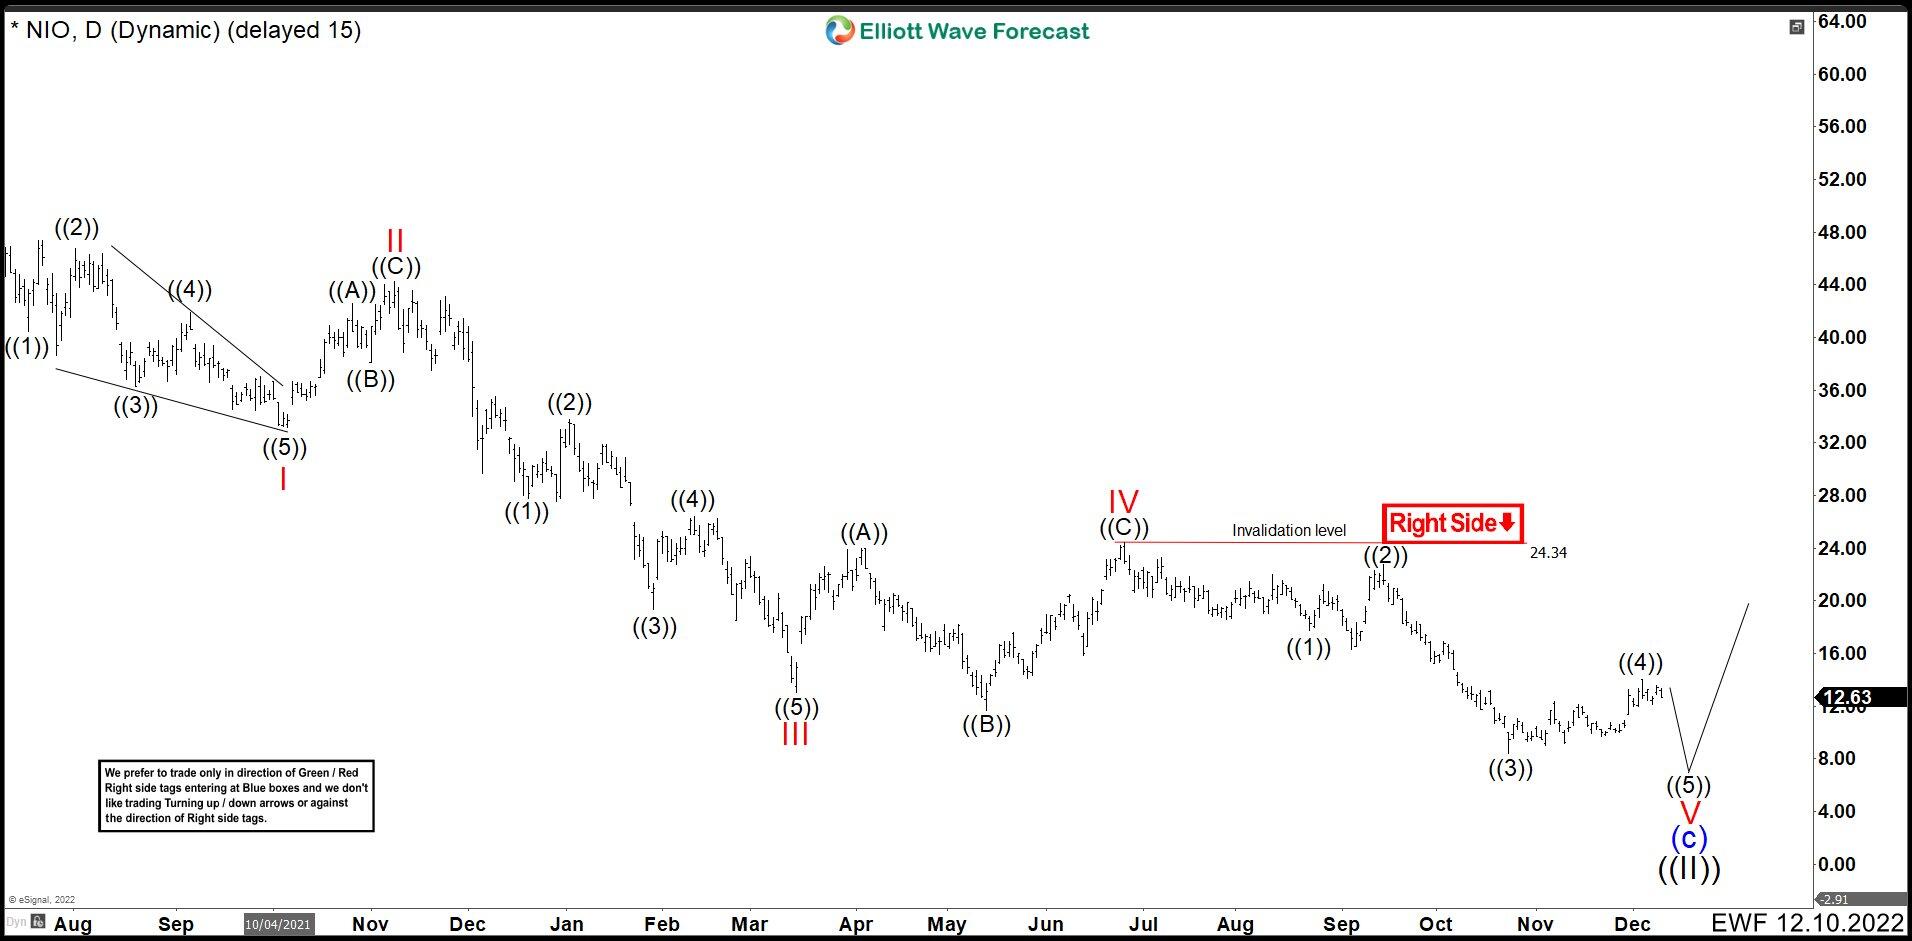
NIO has been falling since early days of 2021. Since then, the market has developed a corrective zig zag structure (a), (b) and (c), of the Elliott Wave Principle. Currently, the stock is close to finish wave (c) the last leg of the zig zag correction and this would trigger a long-term price rally. Above we can see NIO’s daily chart of December 2022. We waited for one more low to end an impulse and complete wave (c) and wave ((II)) of the zig zag correction before starting a new rally. (If you want to learn more about Elliott Wave Theory, please follow these links: Elliott Wave Education and Elliott Wave Theory).

NIO daily chart February 2023

NIO

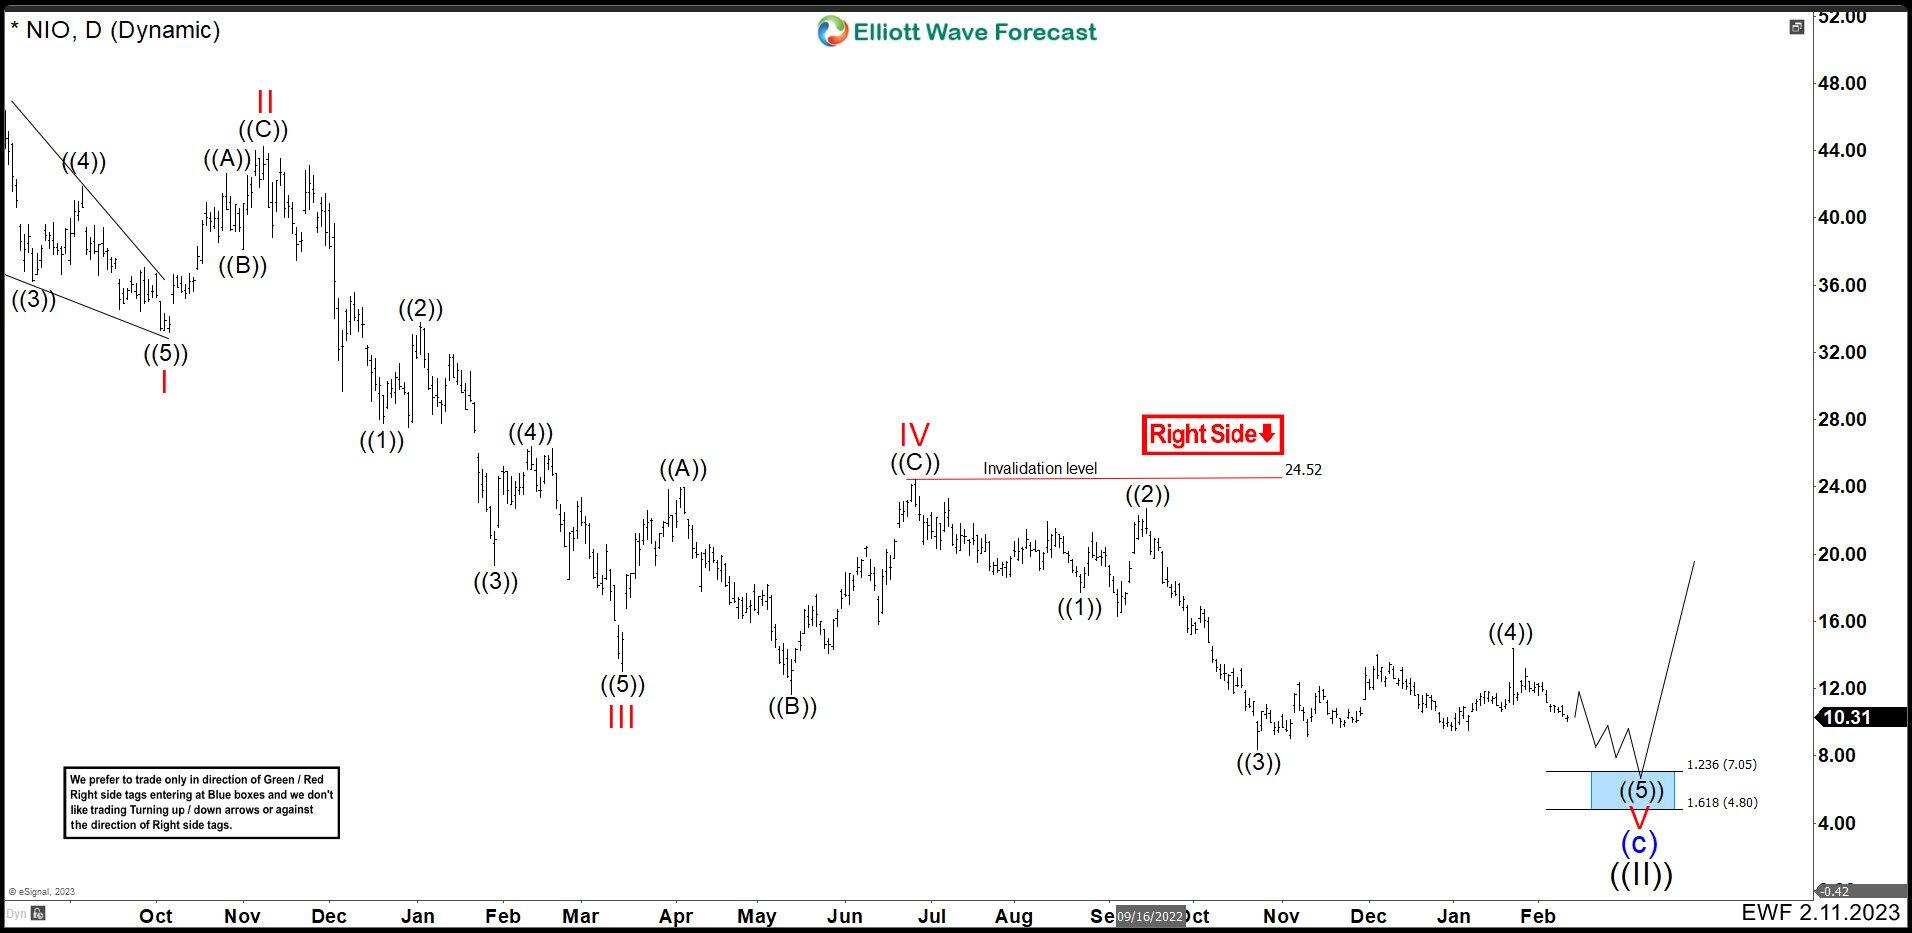
At the beginning of December, NIO turned lower as expected. The January 2023 volatility broke the wave ((4)) high at 14.03, but the move was immediately rejected by the market. This suggested that this breakout is still part of wave ((4)) ending at 14.36. We expect the stock to continue its bearish movement and break wave ((3)) low at 8.28. Once the market breaks this level it will give us a buy signal. We believe that the ideal area to buy is in 7.05 – 4.80 zone, which is where the wave ((II)) should end and continue the uptrend.

Author

Elliott Wave Forecast Team

Elliott Wave Forecast Team

ElliottWave-Forecast.com

More from Elliott Wave Forecast Team
Share:

Editor's Picks

EUR/USD stays weak near 1.1850 after dismal German ZEW data

EUR/USD remains in the red near 1.1850 in the European session on Tuesday. A broad US Dollar bullish consolidation combined with a softer risk tone keep the pair undermined alongside downbeat German ZEW sentiment readings for February. 

GBP/USD holds losees near 1.3600 after weak UK jobs report

GBP/USD is holding moderate losses near the 1.3600 level in Tuesday's European trading. The United Kingdom employment data suggested worsening labor market conditions, bolstering bets for a BoE interest rate cut next month. This narrative keeps the Pound Sterling under bearish pressure. 

Gold pares intraday losses; keeps the red above $4,900 amid receding safe-haven demand

Gold (XAU/USD) attracts some follow-through selling for the second straight day and dives to over a one-week low, around the $4,858 area, heading into the European session on Tuesday. 

Canada CPI expected to show sticky inflation in January, still above BoC’s target

Economists see the headline CPI rising by 2.4% in a year to January, still above the BoC’s target and matching December’s increase. On a monthly basis, prices are expected to rise by 0.1%.

UK jobs market weakens, bolstering rate cut hopes

In the UK, the latest jobs report made for difficult reading. Nonetheless, this represents yet another reminder for the Bank of England that they need to act swiftly given the collapse in inflation expected over the coming months. 

Stellar mixed sentiment caps recovery

Stellar price remains under pressure, trading at $0.170 on Tuesday after failing to close above the key resistance on Sunday. The derivatives metric supports the bearish sentiment, with XLM’s short bets rising among traders and funding rates turning negative.