DJI Elliott Wave technical analysis [Video]
![DJI Elliott Wave technical analysis [Video]](https://editorial.fxstreet.com/images/Markets/Equities/DowJones/bloomberg-app-on-iphone-4-with-market-data-17118657_XtraLarge.jpg)
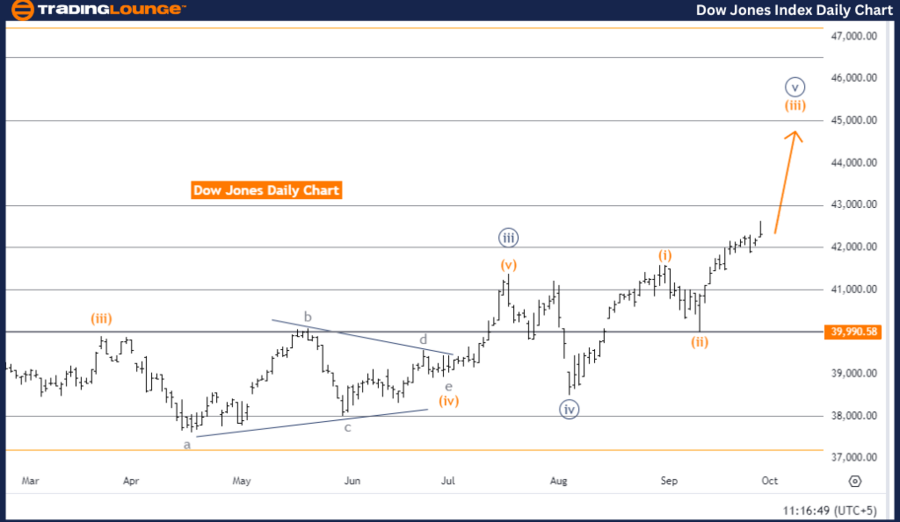
DOW JONES - DJI Elliott Wave Analysis Trading Lounge Day Chart,
DOW JONES - DJI Elliott Wave technical analysis
Function: Bullish Trend.
Mode: Impulsive.
Structure: Orange Wave 3.
Position: Navy Blue Wave 5.
Direction next higher degrees: Orange Wave 3 (in progress).
Details: Orange Wave 2 appears to be complete, with Orange Wave 3 now underway.
Cancel invalid level: 39,990.58.
The Dow Jones (DJI) Elliott Wave Analysis for the daily chart signals a bullish trend, indicating upward movement in the market. The trend mode is impulsive, which means the market is advancing strongly in the direction of the trend. The wave structure being analyzed is Orange Wave 3, a crucial phase in this bullish movement.
Currently, the market is positioned in Navy Blue Wave 5, which forms part of a larger bullish trend. Orange Wave 3 has just begun after the completion of Orange Wave 2. Orange Wave 2, which served as a corrective phase, is now viewed as complete, allowing the bullish momentum to continue through Orange Wave 3.
In Elliott Wave Theory, Wave 3 is often the most powerful and significant phase of an impulsive trend. This suggests that the market could experience further upward movement as Orange Wave 3 unfolds. The combination of an impulsive trend and the early stages of Wave 3 points toward potential continued gains in the Dow Jones index.
A key invalidation level has been set at 39,990.58. Should the market drop below this level, the current Elliott Wave analysis would be invalidated, indicating that the bullish wave structure is no longer applicable, and a re-evaluation of the market trend would be required. This invalidation level is critical for traders to monitor, as it serves as a marker for determining whether the bullish trend is still intact.
Summary
The Dow Jones Elliott Wave analysis continues to point to a bullish trend, with Orange Wave 3 driving the upward movement. Traders should pay close attention to the invalidation level of 39,990.58. As long as the market stays above this level, the bullish outlook remains confirmed, and further gains are expected.
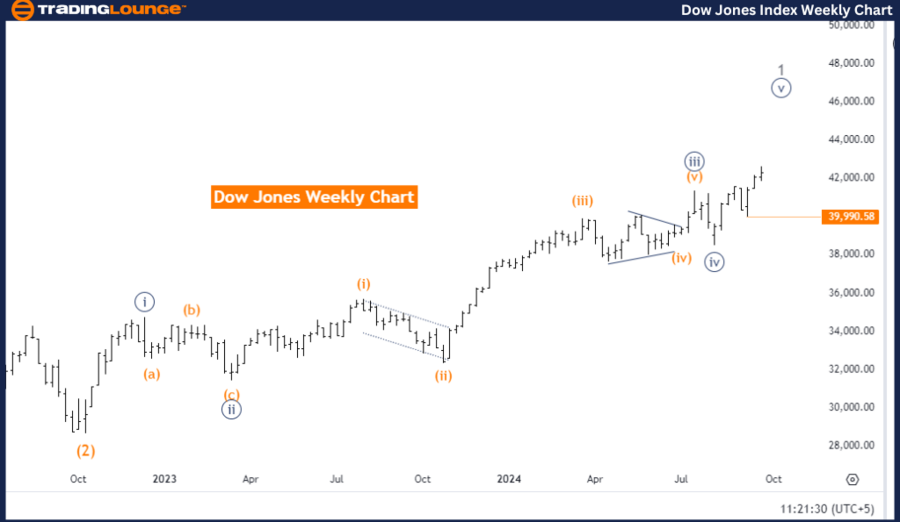
DOW JONES - DJI Elliott Wave Analysis Trading Lounge Weekly Chart,
DOW JONES - DJI Elliott Wave Technical Analysis
Function: Bullish Trend.
Mode: Impulsive.
Structure: Navy Blue Wave 5.
Position: Gray Wave 1.
Direction next higher degrees: Gray Wave 2.
Details: Navy Blue Wave 4 appears completed, with Navy Blue Wave 5 now in progress.
Cancel invalid level: 39,990.58.
The Dow Jones (DJI) Elliott Wave Analysis for the weekly chart indicates a bullish trend, showing an upward movement in the market. The mode of this trend is impulsive, which generally signals strong market momentum. The wave structure being analyzed is Navy Blue Wave 5, a key element in the ongoing bullish trend.
Currently, the market is positioned in Gray Wave 1, part of a broader upward sequence. Following the completion of Navy Blue Wave 4, the analysis suggests that Navy Blue Wave 5 is now in progress, continuing the upward trend. This phase is significant as Wave 5 often represents the final leg in an impulsive wave cycle, which may suggest further gains in the market before any potential correction.
The next lower degree direction is expected to be Gray Wave 2, typically a corrective phase after the completion of Gray Wave 1. However, at this point, Gray Wave 1 is still unfolding, and the bullish momentum from Navy Blue Wave 5 is expected to push the market higher before any corrective movements begin.
A critical invalidation level is set at 39,990.58. If the market moves below this level, the current Elliott Wave analysis would be invalidated, meaning the bullish trend would no longer apply, and the wave structure would require reassessment. This level is crucial for traders to monitor, as staying above it confirms the continuation of the bullish trend.
Summary
The Dow Jones Elliott Wave analysis for the weekly chart highlights a continued bullish trend, driven by Navy Blue Wave 5. The market is progressing through Gray Wave 1, and traders should closely observe the 39,990.58 invalidation level to ensure the strength of the bullish trend.
Technical Analyst: Malik Awais.
DOW JONES - DJI Elliott Wave technical analysis [Video]
Author

Peter Mathers
TradingLounge
Peter Mathers started actively trading in 1982. He began his career at Hoei and Shoin, a Japanese futures trading company.


