![]() Elliott Wave Forecast Team
Elliott Wave Forecast Team
ElliottWave-Forecast.com
Disney has been in a tremendous decline since it peaked at $203.02 back 03.08.2021. The Peak ended a Grand Super Cycle and since then it has corrected in larger pullback. The Elliott Wave Theory provides us with cycle degrees determined by the time each cycle lasts. So the Grand Super Cycle is the highest cycle degree and can sometimes last even centuries. Here is the page that explains all the details within the Theory and provides new traders with enough guidelines to navigate the market. Let’s take a look at the Elliott Wave outlook for Disney.
Disney ($DIS) monthly Elliott Wave chart
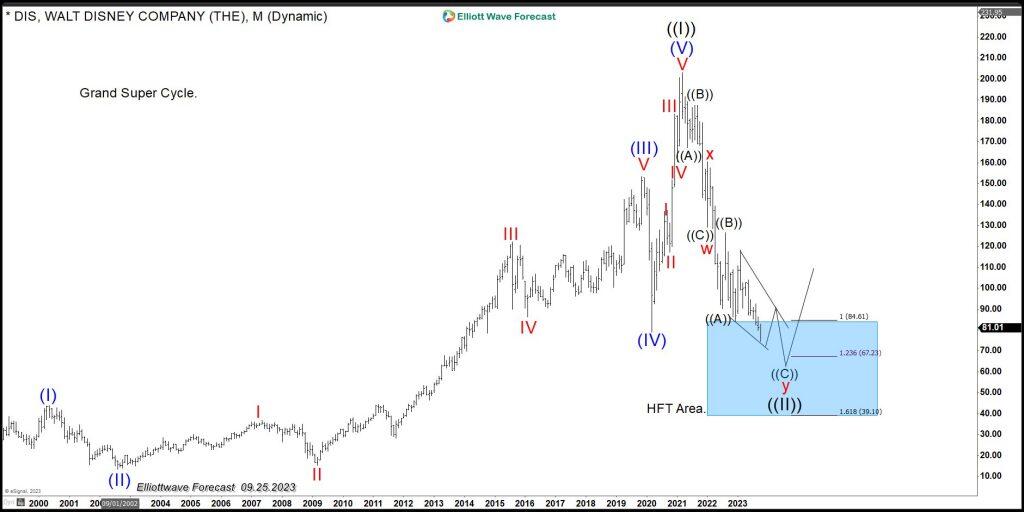
The chart above is the representation of the Grand Super Cycle and clearly shows a five-wave advance in the Blue degree which ended wave ((I)) Grand Super Cycle. The idea of the five waves means overall that three waves of pullback are next to happen based on the Elliott Wave Theory. Sure enough $DIS have then seen a tremendous decline in wave ((II)) in Grand Super Cycle degree. The symbol has reached the minimum distance within the decline and has reached the buying area. The Elliott Wave Theory primary pattern states that the market moves in five waves in each cycle, then three waves pullback. Afterwards, a continuation higher in the direction of the previous five waves. This is a straightforward behavior that repeats itself time after time.
Impulse Elliott Wave structure
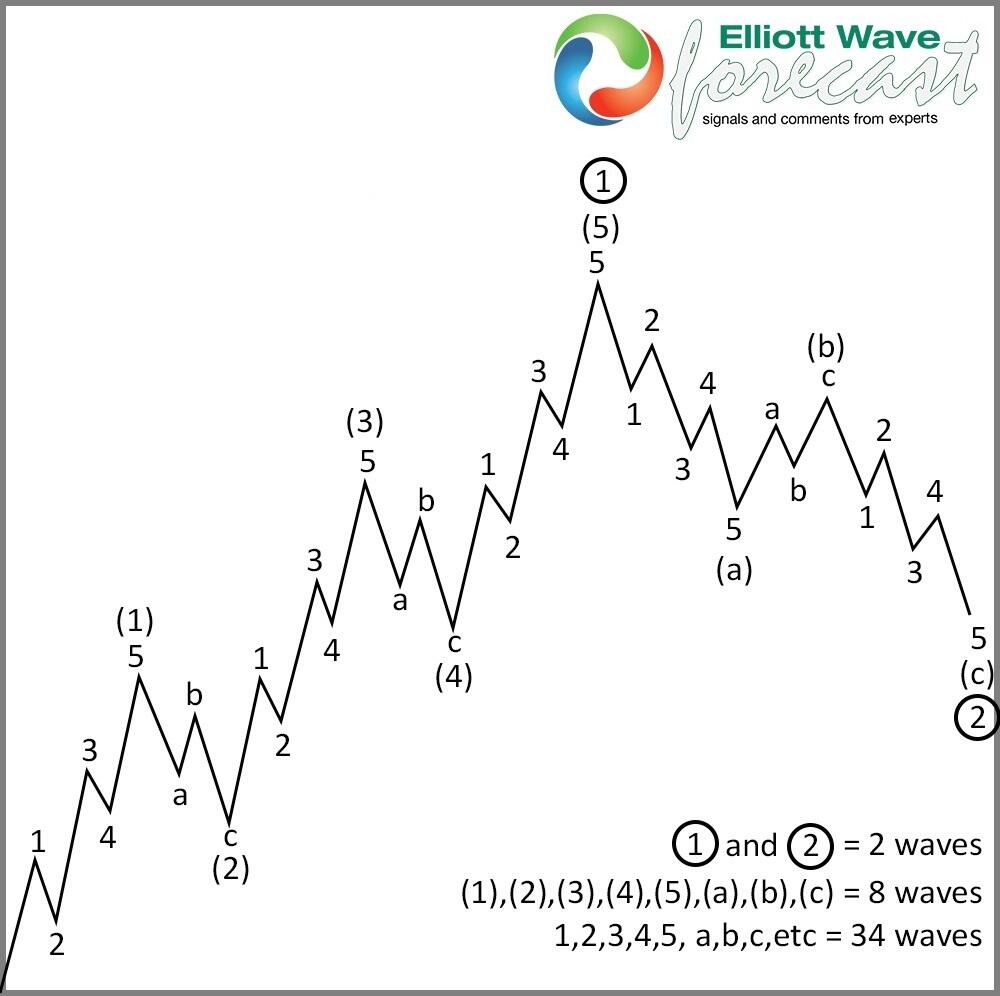
The graph above shows the five waves advance and the three waves pullback. It looks similar compared to the $DIS Monthly chart. Analyzing the charts of Disney within the Grand Super Cycle makes it easy to understand this decline. It is a great and unique opportunity to buy the stock and hold it for a long time.
$DIS weekly Elliott Wave chart
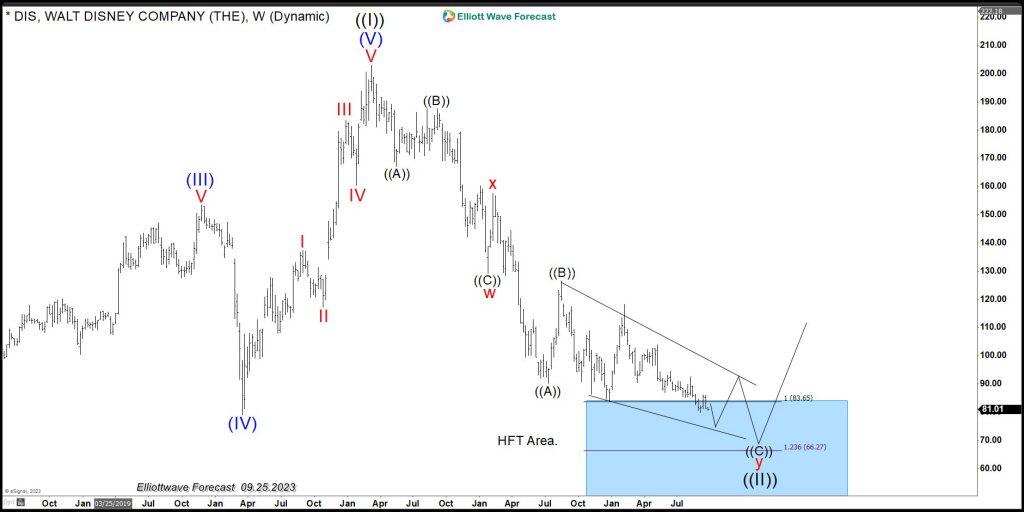
Zooming in on the Weekly chart above, we see how the decline unfolds in a WXY. It is a seven-swing structure which consists of 2 ABC combination. Hence, the market follows a sequence of 5-3-5-3-5-3-5. It should end around 1.00-1.618% of W related to X. At this moment, we are trading within the area, which is represented with the blue box. As seen from the char above, down from wave ((1)), the stock did three waves lower or an ABC, which ended around 01.01.2022. The stock then bounced in wave X and then entered another leg lower. Right now it is trading within the Blue Box area or the 1.00-1.618% Fibonacci extension.
WXY double three structure
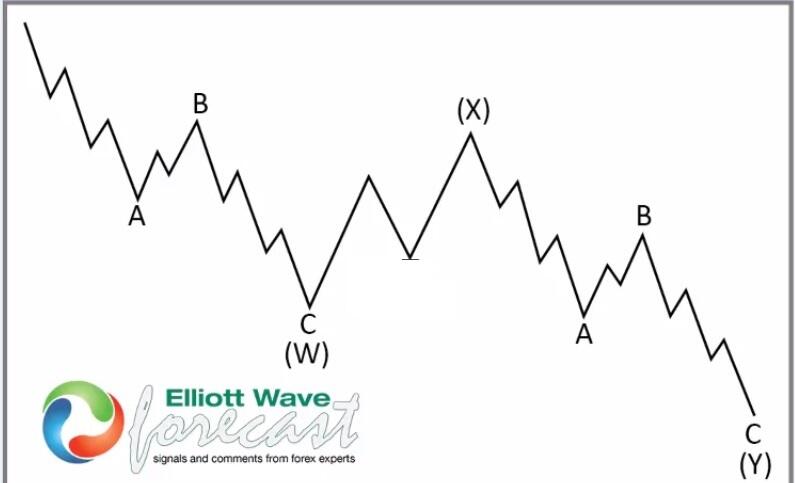
The graph above shows how a WXY looks in the Theory. Comparing this to the Weekly chart of Disney, it is fair to say they look alike. Soon Disney will start a new cycle higher and provide investors with an excellent opportunity to ride a very good long position. The Market follows patterns, and the Elliott Wave Theory helps us to identify them and take chances in favor of the trend.
FURTHER DISCLOSURES AND DISCLAIMER CONCERNING RISK, RESPONSIBILITY AND LIABILITY Trading in the Foreign Exchange market is a challenging opportunity where above average returns are available for educated and experienced investors who are willing to take above average risk. However, before deciding to participate in Foreign Exchange (FX) trading, you should carefully consider your investment objectives, level of xperience and risk appetite. Do not invest or trade capital you cannot afford to lose. EME PROCESSING AND CONSULTING, LLC, THEIR REPRESENTATIVES, AND ANYONE WORKING FOR OR WITHIN WWW.ELLIOTTWAVE- FORECAST.COM is not responsible for any loss from any form of distributed advice, signal, analysis, or content. Again, we fully DISCLOSE to the Subscriber base that the Service as a whole, the individual Parties, Representatives, or owners shall not be liable to any and all Subscribers for any losses or damages as a result of any action taken by the Subscriber from any trade idea or signal posted on the website(s) distributed through any form of social-media, email, the website, and/or any other electronic, written, verbal, or future form of communication . All analysis, trading signals, trading recommendations, all charts, communicated interpretations of the wave counts, and all content from any media form produced by www.Elliottwave-forecast.com and/or the Representatives are solely the opinions and best efforts of the respective author(s). In general Forex instruments are highly leveraged, and traders can lose some or all of their initial margin funds. All content provided by www.Elliottwave-forecast.com is expressed in good faith and is intended to help Subscribers succeed in the marketplace, but it is never guaranteed. There is no “holy grail” to trading or forecasting the market and we are wrong sometimes like everyone else. Please understand and accept the risk involved when making any trading and/or investment decision. UNDERSTAND that all the content we provide is protected through copyright of EME PROCESSING AND CONSULTING, LLC. It is illegal to disseminate in any form of communication any part or all of our proprietary information without specific authorization. UNDERSTAND that you also agree to not allow persons that are not PAID SUBSCRIBERS to view any of the content not released publicly. IF YOU ARE FOUND TO BE IN VIOLATION OF THESE RESTRICTIONS you or your firm (as the Subscriber) will be charged fully with no discount for one year subscription to our Premium Plus Plan at $1,799.88 for EACH person or firm who received any of our content illegally through the respected intermediary’s (Subscriber in violation of terms) channel(s) of communication.
Recommended content
Editors’ Picks
EUR/USD clings to strong daily gains near 1.0900
EUR/USD trades at its strongest level since mid-October near 1.0900 after starting the week with a bullish gap. The uncertainty surrounding the US election outcome weighs on the US Dollar and helps the pair continue to push higher.

GBP/USD holds above 1.2950 as USD stays under pressure
GBP/USD stays in positive territory above 1.2950 after failing to clear 1.3000 earlier in the day. Heading into the US presidential election, the 10-year US Treasury bond yield is down more than 2% on the day, weighing on the USD and allowing the pair to hold its ground.

Gold trades around $2,730
Gold price is on the defensive below $2,750 in European trading on Monday, erasing the early gains. The downside, however, appears elusive amid the US presidential election risks and the ongoing Middle East geopolitical tensions.

Three fundamentals for the week: Toss up US election, BoE and Fed promise a roller coaster week Premium
Harris or Trump? The world is anxious to know the result of the November 5 vote – and may have to wait long hours for the outcome. Markets will also respond to the composition of Congress. The Bank of England and the Federal Reserve will enter the fray afterward.

US presidential election outcome: What could it mean for the US Dollar? Premium
The US Dollar has regained lost momentum against its six major rivals at the beginning of the final quarter of 2024, as tensions mount ahead of the highly anticipated United States Presidential election due on November 5.

Best Forex Brokers with Low Spreads
VERIFIED Low spreads are crucial for reducing trading costs. Explore top Forex brokers offering competitive spreads and high leverage. Compare options for EUR/USD, GBP/USD, USD/JPY, and Gold.