DIS (Walt Disney Company): A huge rally into $286.00 might have started

Walt Disney shares have been trading lower since they peaked on 03.08.2021. Since then, the symbol has been doing a WXY structure which comes with seven swings. This structure most of the time ends when the W equals the Y in relation to X.
WXY double three Elliott Wave structure
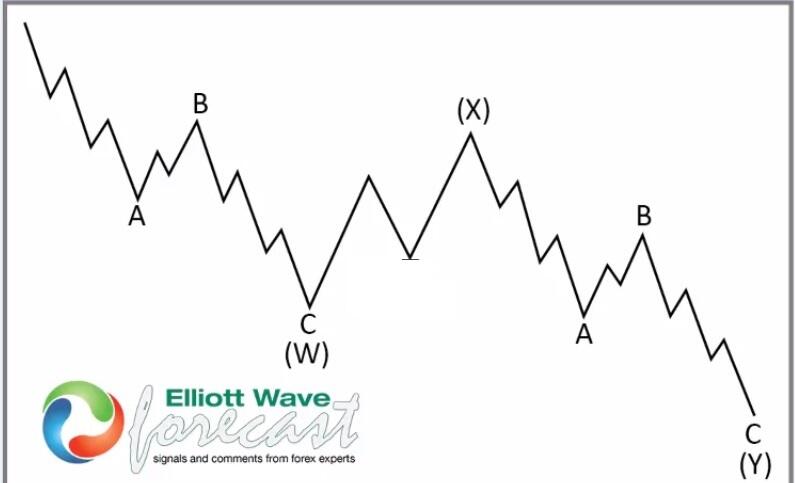
It represents a WXY within the Elliott Wave Theory and all the information can be found at this page. The market has changed over the years and computers have played a role in today’s trading. We call those High-Frequency areas and show them on the chart with the Blue Box. Blue Boxes are areas where the two sides of the Market ( buyers and sellers) agree to a reaction.
These areas are based on a combination of the market nature, extension, and sequence. Many traders are guilty of entering the market in a stage that we call the middle. They suffer losses because knowing the area where both sides agree is the key. Blue Boxes have a 85% chance to produce a bounce only when a cycle ends at a higher degree and a new counter trend cycle start. Then, a five waves decline can happen, making the box fail but then providing another chance at a higher degree.
Getting back to DIS, the symbol ended the Grand Super Cycle and produced a seven-swing structure with a target of $83.89-$66.51 area.
Weekly Disney Elliott Wave chart
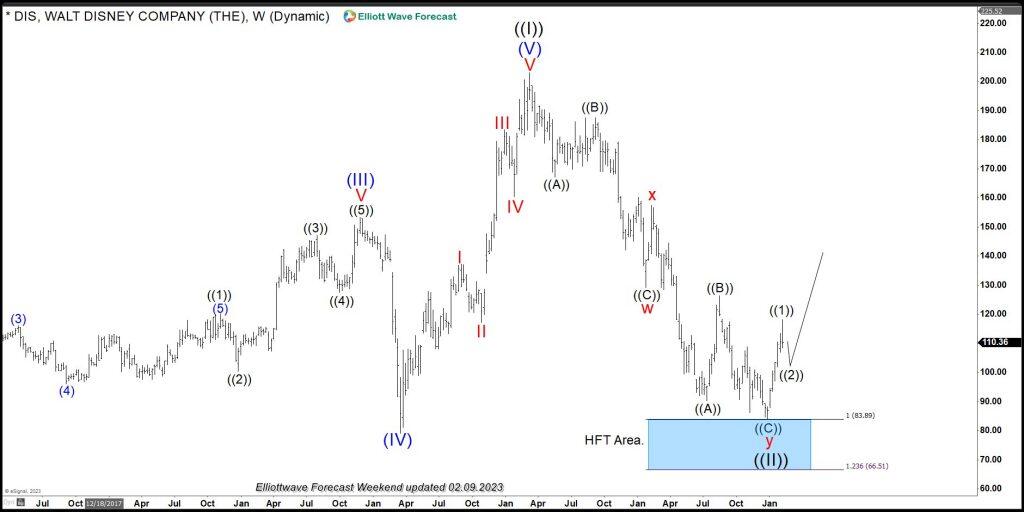
The above chart shows the decline, and it is easy to identify the seven swing structures, which we label as wxy. . We can see in the chart the blue box area and how the sellers were able to make a profit at the Blue Box. However, more importantly, the intelligent buyers were able to enter at the right level, which was the top of the Blue Box at $83.89.
Since reaching the blue box, the symbol has reacted impulsively. We expect further upside which can take the symbol into the $286.00 area in years to come. The Elliott Wave Theory, together with the High-Frequency Trading recognize cycles. The idea that the correction from 2012 until the lows in 2023 was the Grand Super Cycle makes us believe that at one point, the symbol will break the 2021 peak. The next target blue box to the upside will come at $286.00. The target is a long way from the current levels, but the plan is very clear. It is time to buy the dips instead of selling the rallies.
In conclusion, the market has changed. Using the Elliott Wave Theory tools in relationship with the High-Frequency Trading Machines is the way to go. The system provides a straightforward entry and also a target and provides a lovely and reliable timing to trade the market. It’s much better than the Theory as originally developed in the 1930s.
Author

Elliott Wave Forecast Team
ElliottWave-Forecast.com


