- DIDI stock is up more than 65% in Monday's premarket.
- The Chinese government announced the end of an investigation of its data practices.
- Didi Global shares IPO'd at $14 last summer and are slated to delist.
Didi Global (DIDI) stock spiked 66% in Monday's premarket to $3.07 after Chinese government regulators formally ended their investigation of its data practices. The government also ended similar reviews of Full Truck Alliance (YMM) and Kanzhun (BZ).
Didi Global Stock News: A fine is yet to be assessed
The Wall Street Journal says that Didi Global's ride-sharing app will be back in app stores as soon as this week. After debuting on June 30, 2021, at $14, the Chinese government decided to get back at the UBER of China for listing shares in the US. It came out that they had disapproved of the listing ahead of time and made it known to management. Didi's popular app was removed from Chinese app stores, and regulators began investigating its consumer data collection practices. Didi already agreed last month to delist its US shares, so that may have been the requirement to get its app back out to new users and end the investigation.
According to the Journal, Didi Global is expected to pay a rather large fine and transfer 1% of its shares to the Chinese government.
There remains little certainty over the price at which DIDI shares will be repurchased. The company said recently it will submit to Chinese authorities and delist its shares from US exchanges, but there was no color given over whether the company will repurchase them at the origianl IPO price or at the current share price, which was down 87% on Friday.
Shares of other Chinese heavyweights were aided by the news. Alibaba (BABA) rose 7% in the premarket, while Baidu (BIDU) jumped 4%.
Didi Global Stock Forecast: $3.55 is first target
Despite uncertainty over how much Didi will buy back shares from the public, the market likes what it heard this morning. Shares jumped not only past the 50-day moving average but also have found their footing above the 100-day. The 100-day now appears to be acting as support. Now resistance at the March 25 gap down level of $3.55 is the first target for bulls. Above there, $4.25 has shown itself to be strong resistance in the past.
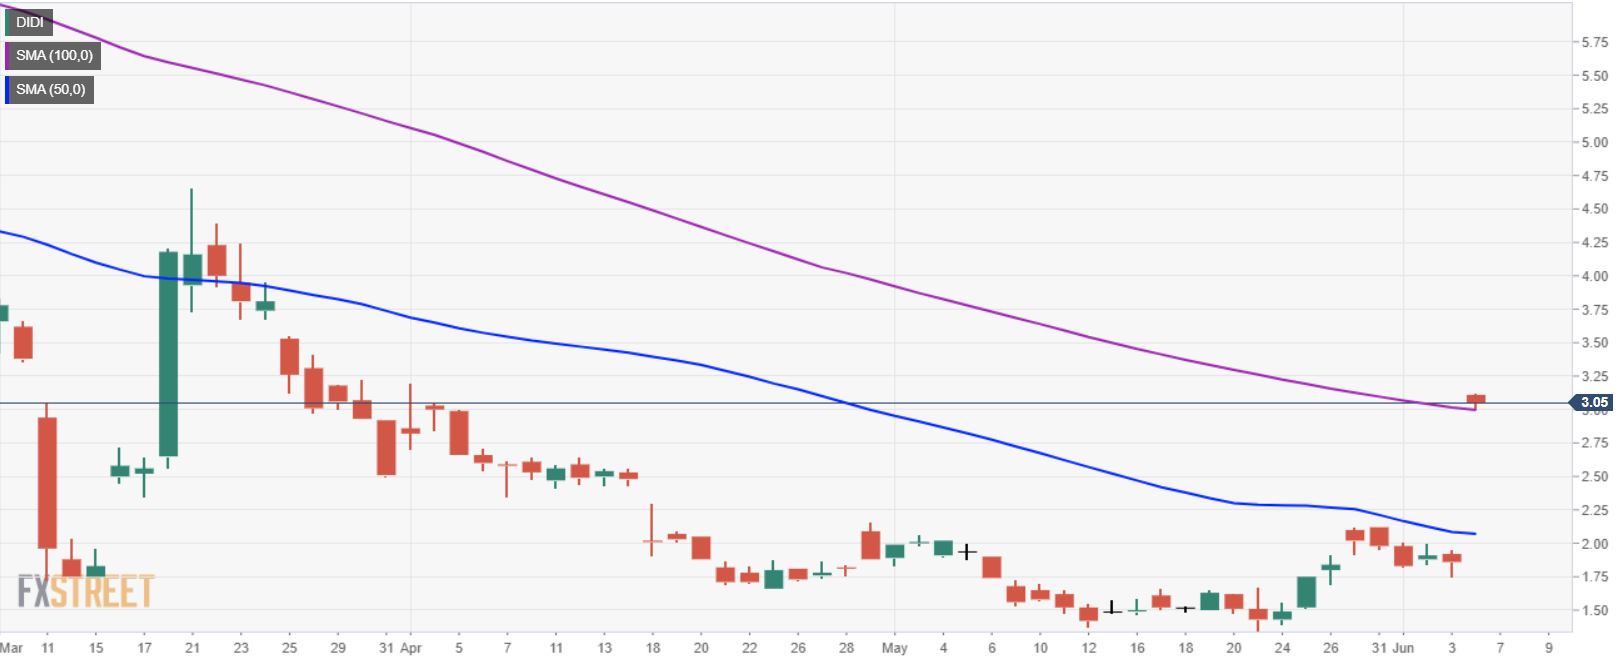
DIDI daily chart
Like this article? Help us with some feedback by answering this survey:
Information on these pages contains forward-looking statements that involve risks and uncertainties. Markets and instruments profiled on this page are for informational purposes only and should not in any way come across as a recommendation to buy or sell in these assets. You should do your own thorough research before making any investment decisions. FXStreet does not in any way guarantee that this information is free from mistakes, errors, or material misstatements. It also does not guarantee that this information is of a timely nature. Investing in Open Markets involves a great deal of risk, including the loss of all or a portion of your investment, as well as emotional distress. All risks, losses and costs associated with investing, including total loss of principal, are your responsibility. The views and opinions expressed in this article are those of the authors and do not necessarily reflect the official policy or position of FXStreet nor its advertisers. The author will not be held responsible for information that is found at the end of links posted on this page.
If not otherwise explicitly mentioned in the body of the article, at the time of writing, the author has no position in any stock mentioned in this article and no business relationship with any company mentioned. The author has not received compensation for writing this article, other than from FXStreet.
FXStreet and the author do not provide personalized recommendations. The author makes no representations as to the accuracy, completeness, or suitability of this information. FXStreet and the author will not be liable for any errors, omissions or any losses, injuries or damages arising from this information and its display or use. Errors and omissions excepted.
The author and FXStreet are not registered investment advisors and nothing in this article is intended to be investment advice.


Recommended content
Editors’ Picks

EUR/USD bounces off 1.1300, Dollar turns red
After bottoming out near the 1.1300 region, EUR/USD now regains upside traction and advances to the 1.1370 area on the back of the ongoing knee-jerk in the US Dollar. Meanwhile, market participants continue to closely follow news surrounding the US-China trade war.

GBP/USD regains pace, retargets 1.3200
The now offered stance in the Greenback lends extra support to GBP/USD and sends the pair back to the vicinity of the 1.3200 hurdle, or multi-day highs, amid a generalised better tone in the risk-linked universe on Monday.

Gold trades with marked losses near $2,200
Gold seems to have met some daily contention around the $3,200 zone on Monday, coming under renewed downside pressure after hitting record highs near $3,250 earlier in the day, always amid alleviated trade concerns. Declining US yields, in the meantime, should keep the downside contained somehow.

Six Fundamentals for the Week: Tariffs, US Retail Sales and ECB stand out Premium
"Nobody is off the hook" – these words by US President Donald Trump keep markets focused on tariff policy. However, some hard data and the European Central Bank (ECB) decision will also keep things busy ahead of Good Friday.

Is a recession looming?
Wall Street skyrockets after Trump announces tariff delay. But gains remain limited as Trade War with China continues. Recession odds have eased, but investors remain fearful. The worst may not be over, deeper market wounds still possible.

The Best brokers to trade EUR/USD
SPONSORED Discover the top brokers for trading EUR/USD in 2025. Our list features brokers with competitive spreads, fast execution, and powerful platforms. Whether you're a beginner or an expert, find the right partner to navigate the dynamic Forex market.