DE Elliott Wave Analysis Trading Lounge.

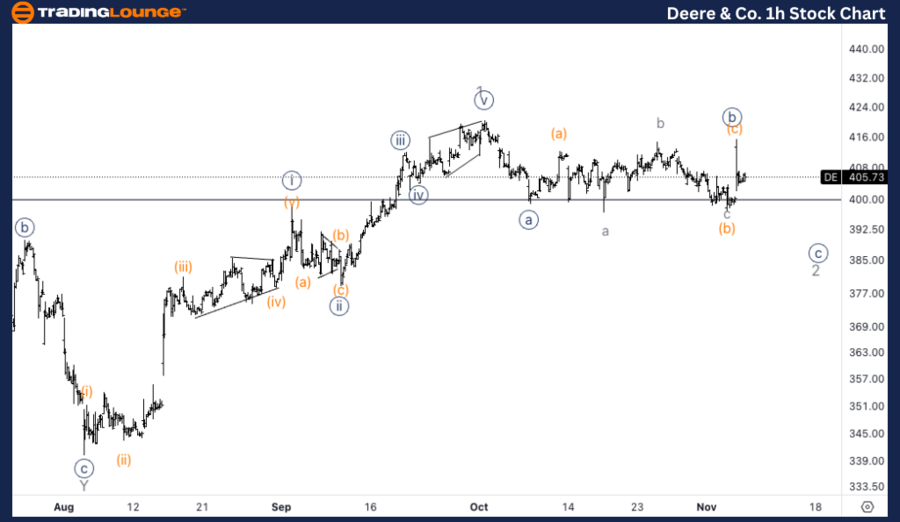
Deere & Co., (DE) Daily Chart.

DE Elliott Wave Technical Analysis

Function: Trend.

Mode: Impulsive.

Structure: Motive.

Position: Wave 2 of (5).

Direction: Bottom in wave 2.

Details: We are looking at a bottom in wave (4) in place at around 330$, with a correction that has lasted a couple of years. As we broke above 400$, we could see further upside to confirm the bullish bias.

Chart

Deere&Co., (DE) 1H Chart

DE Elliott Wave technical analysis

Function: Trend.

Mode: Impulsive.

Structure: Motive.

Position: Wave {c} of 2.

Direction: Downside in wave {c}.

Details: Looking for another leg lower in wave {c} of 2 as we seem to be having a three wave move in wave 2, which keeps finding support on top of MediumLevel 400$.

Chart

This Elliott Wave analysis of Deere&Co., (DE) outlines both the daily and 1-hour chart structures, highlighting the current trends and possible future price movements.

DE Elliott Wave technical analysis – Daily chart

The daily chart indicates that wave (4), a long-term correction spanning a couple of years, has likely completed around $330. After breaking above the critical resistance at $400, there is a growing bullish bias that suggests the beginning of wave (5). As the market confirms this breakout, we could anticipate further upside in the long-term impulsive structure. Continued moves above $400 will solidify the bullish trend and target higher levels in wave 3 of (5).

DE Elliott Wave technical analysis – One-hour chart

The 1-hour chart suggests that the correction within wave 2 is still unfolding, with a three-wave corrective structurelikely forming. Specifically, wave {c} of 2 is expected to bring another leg lower, testing support levels around MediumLevel 400. This area has acted as a solid support zone during the correction, and the next downside move in wave {c} will determine whether the correction is near completion.

Technical analyst: Alessio Barretta.

DE Elliott Wave technical analysis [Video]

Share: Feed news

As with any investment opportunity there is a risk of making losses on investments that Trading Lounge expresses opinions on.

Historical results are no guarantee of future returns. Some investments are inherently riskier than others. At worst, you could lose your entire investment. TradingLounge™ uses a range of technical analysis tools, software and basic fundamental analysis as well as economic forecasts aimed at minimizing the potential for loss.

The advice we provide through our TradingLounge™ websites and our TradingLounge™ Membership has been prepared without considering your objectives, financial situation or needs. Reliance on such advice, information or data is at your own risk. The decision to trade and the method of trading is for you alone to decide. This information is of a general nature only, so you should, before acting upon any of the information or advice provided by us, consider the appropriateness of the advice considering your own objectives, financial situation or needs. Therefore, you should consult your financial advisor or accountant to determine whether trading in securities and derivatives products is appropriate for you considering your financial circumstances.

Recommended content


Recommended content

Editors’ Picks

AUD/USD stands firm near 0.6350 after Australian trade data

AUD/USD stands firm near 0.6350 after Australian trade data

AUD/USD holds higher ground near 0.6350 early Thursday, sitting at weekly highs after stronger-than-expected Australian Trade Balance data for January. Further, the pair capitalizes on sustained US Dollar weakness on Trump's tariffs-led US economic concerns and dovish Fed expectations. 

AUD/USD News
USD/JPY bounces back toward 149.50 on firmer US Treasury yields

USD/JPY bounces back toward 149.50 on firmer US Treasury yields

USD/JPY catches fresh bids and bounces toward 149.50 in Thursday's Asian trading. The pair draws support from rising US Treasury bond yields, which cushion the US Dollar downside. However, BoJ rate hike bets could limit the pair's upside amid lingering global trade war fears. 

USD/JPY News
Gold price looks to all-time highs at $2,956, awaiting US Nonfarm Payrolls

Gold price looks to all-time highs at $2,956, awaiting US Nonfarm Payrolls

Gold price is sitting at one-week highs near $2,930 early Thursday, consolidating a three-day recovery while aiming for a retest of lifetime highs of $2,956 ahead of mid-tier US economic data releases.

Gold News
Ethereum holds $2,200 support despite Pectra's issues on Sepolia testnet

Ethereum holds $2,200 support despite Pectra's issues on Sepolia testnet

Ethereum is up on Wednesday after developers fixed issues with the Pectra upgrade's deployment on the Sepolia testnet. The top altcoin aims to hold the $2,200 support level amid negative sentiments from Pectra's failure on testnets.

Read more
Why AAVE is rallying even as Bitcoin, Ethereum, XRP lag

Why AAVE is rallying even as Bitcoin, Ethereum, XRP lag

Aave (AAVE), the native token of the Aave lending protocol, is rallying on Wednesday as the crypto market recovers from Monday’s bloodbath. Bitcoin (BTC), Ethereum (ETH), and XRP note small gains on the day as traders maintain a risk-averse stance in crypto, grappling with volatility concerns this week ahead of the White House Crypto Summit on Friday. 

Read more
The Best brokers to trade EUR/USD

The Best brokers to trade EUR/USD

SPONSORED Discover the top brokers for trading EUR/USD in 2025. Our list features brokers with competitive spreads, fast execution, and powerful platforms. Whether you're a beginner or an expert, find the right partner to navigate the dynamic Forex market.

Read More

Forex MAJORS

Cryptocurrencies

Signatures

Best Brokers of 2025