Decoding bearish analog and the warning signs you can't ignore [Video]
![Decoding bearish analog and the warning signs you can't ignore [Video]](https://editorial.fxstreet.com/images/Markets/Equities/market-analyze-18914145_XtraLarge.jpg)
Watch the video extracted from the WLGC session before the market open on 6 Feb 2024 below to find out the following:
-
The bearish analogue structure that the S&P 500 could be unfolding.
-
The 3 warning signs that you can't ignore.
-
How to position your trading strategy in this over-extended market.
-
The immediate downside target according to the bearish analogue.
-
and a lot more...
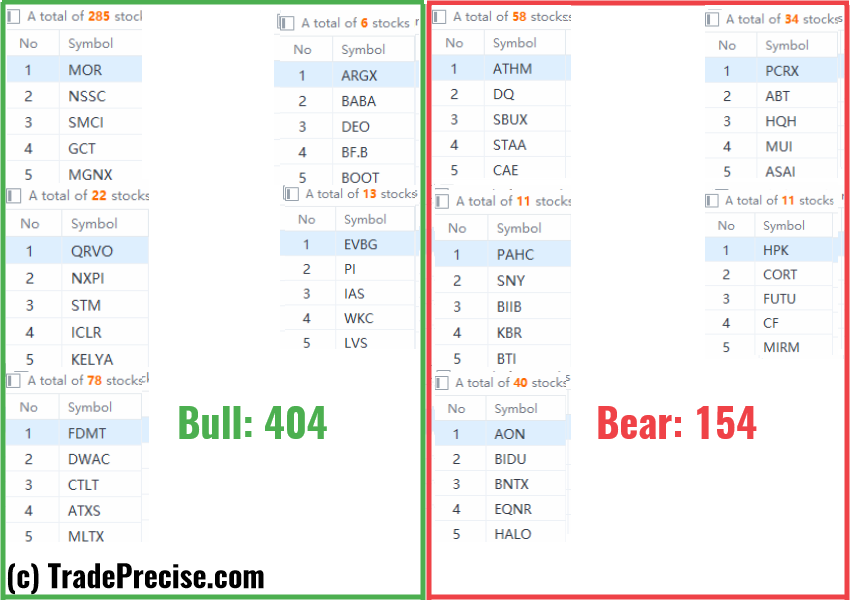
The bullish vs. bearish setup is 404 to 154 from the screenshot of my stock screener below. Despite being a positive and healthy market environment, the deterioration in both the long-term and the short-term market breadth prompted a red flag.
The bearish condition (not the timing) is here and a confirmation from the price action (plus the volume) will give the green light for the bear. The extent of the potential pullback is dependent on the market rotation as discussed in the tweet below:
"Looking at $IWM or the $RTY. This is not overbought at all. That is a rally, a two legged pullback, tested a support, reversal, and then forming a small flag. This is a small flag and a breakout yesterday." #Russell2000 pic.twitter.com/7e3aHMkqTl
— Ming Jong Tey (@MingJong) January 31, 2024
13 “low-hanging fruits” (ALXO, SRPT, etc…) trade entries setup + 11 actionable setups (ACLX etc…) plus 16 “wait and hold” candidates are discussed in the video (34:28) below the paywall accessed by subscribing members.
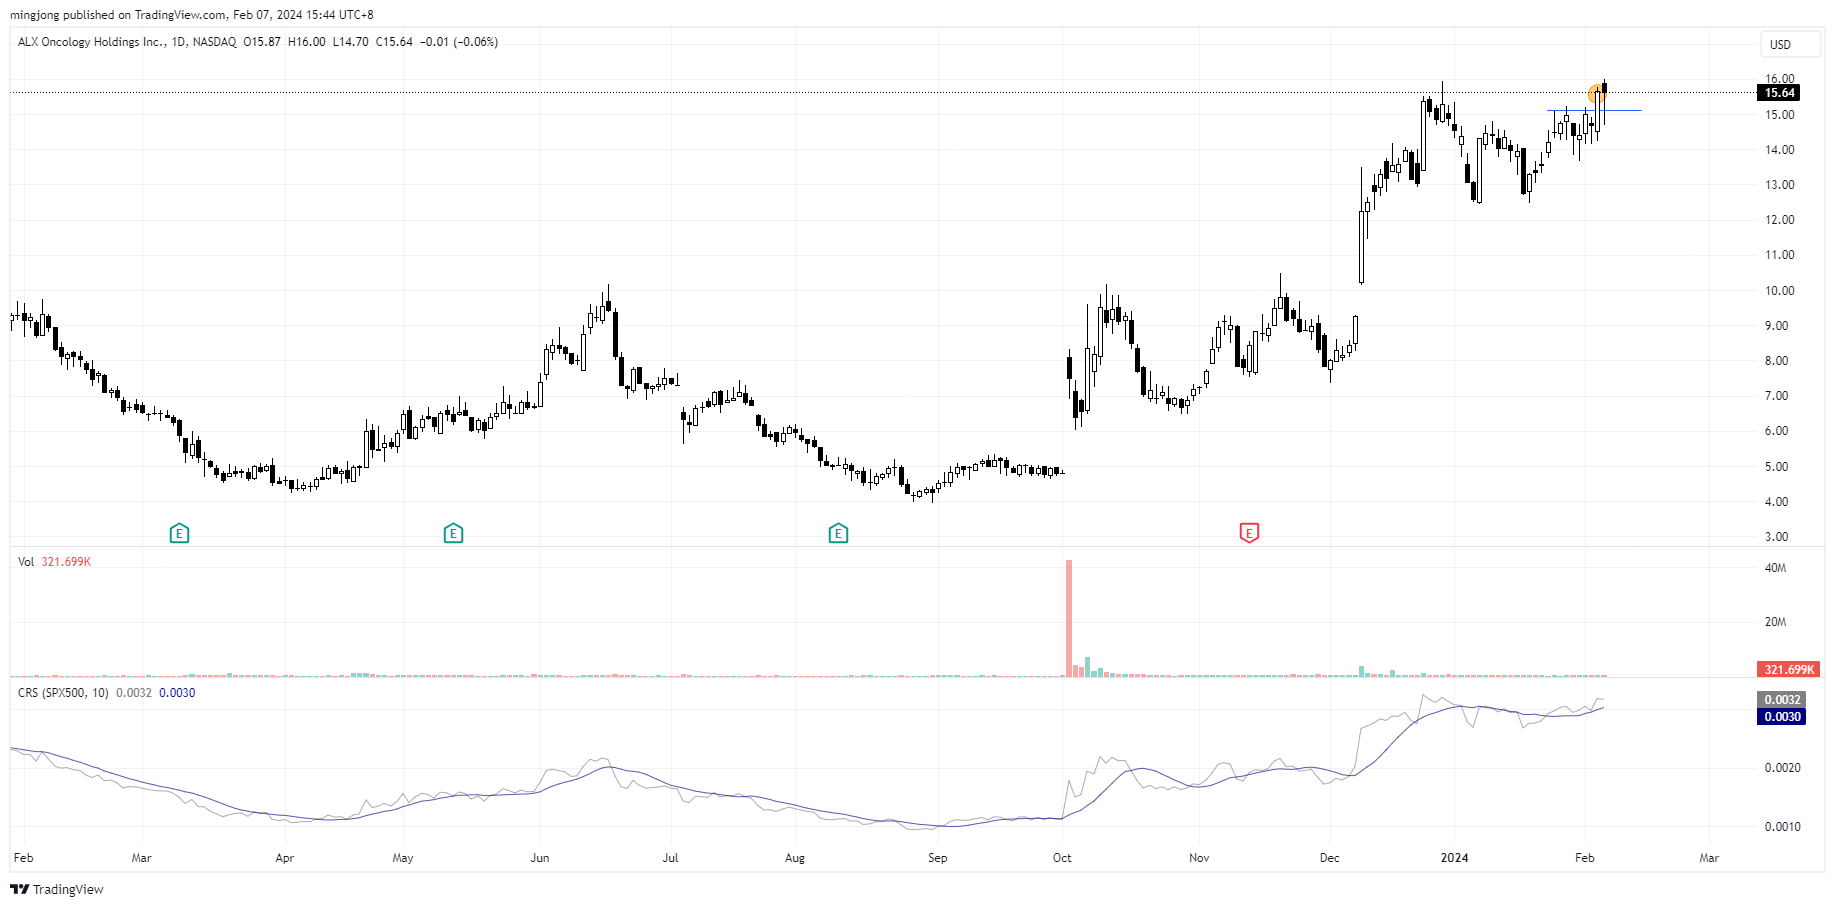
ALXO
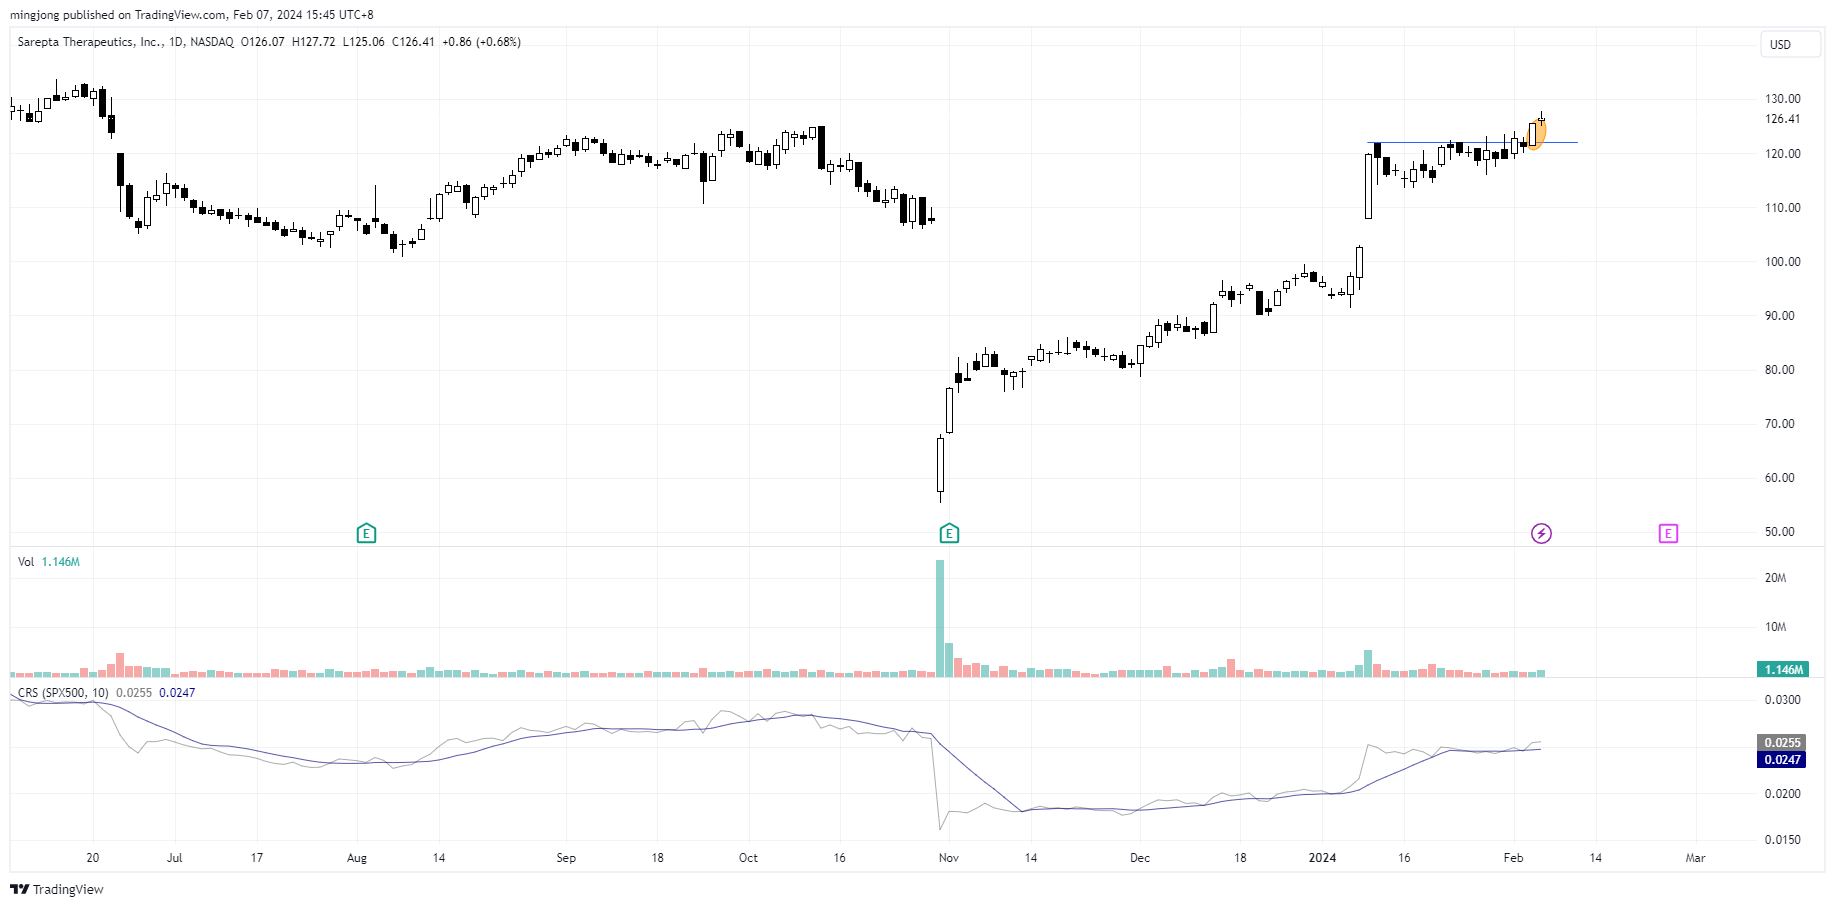
SRPT
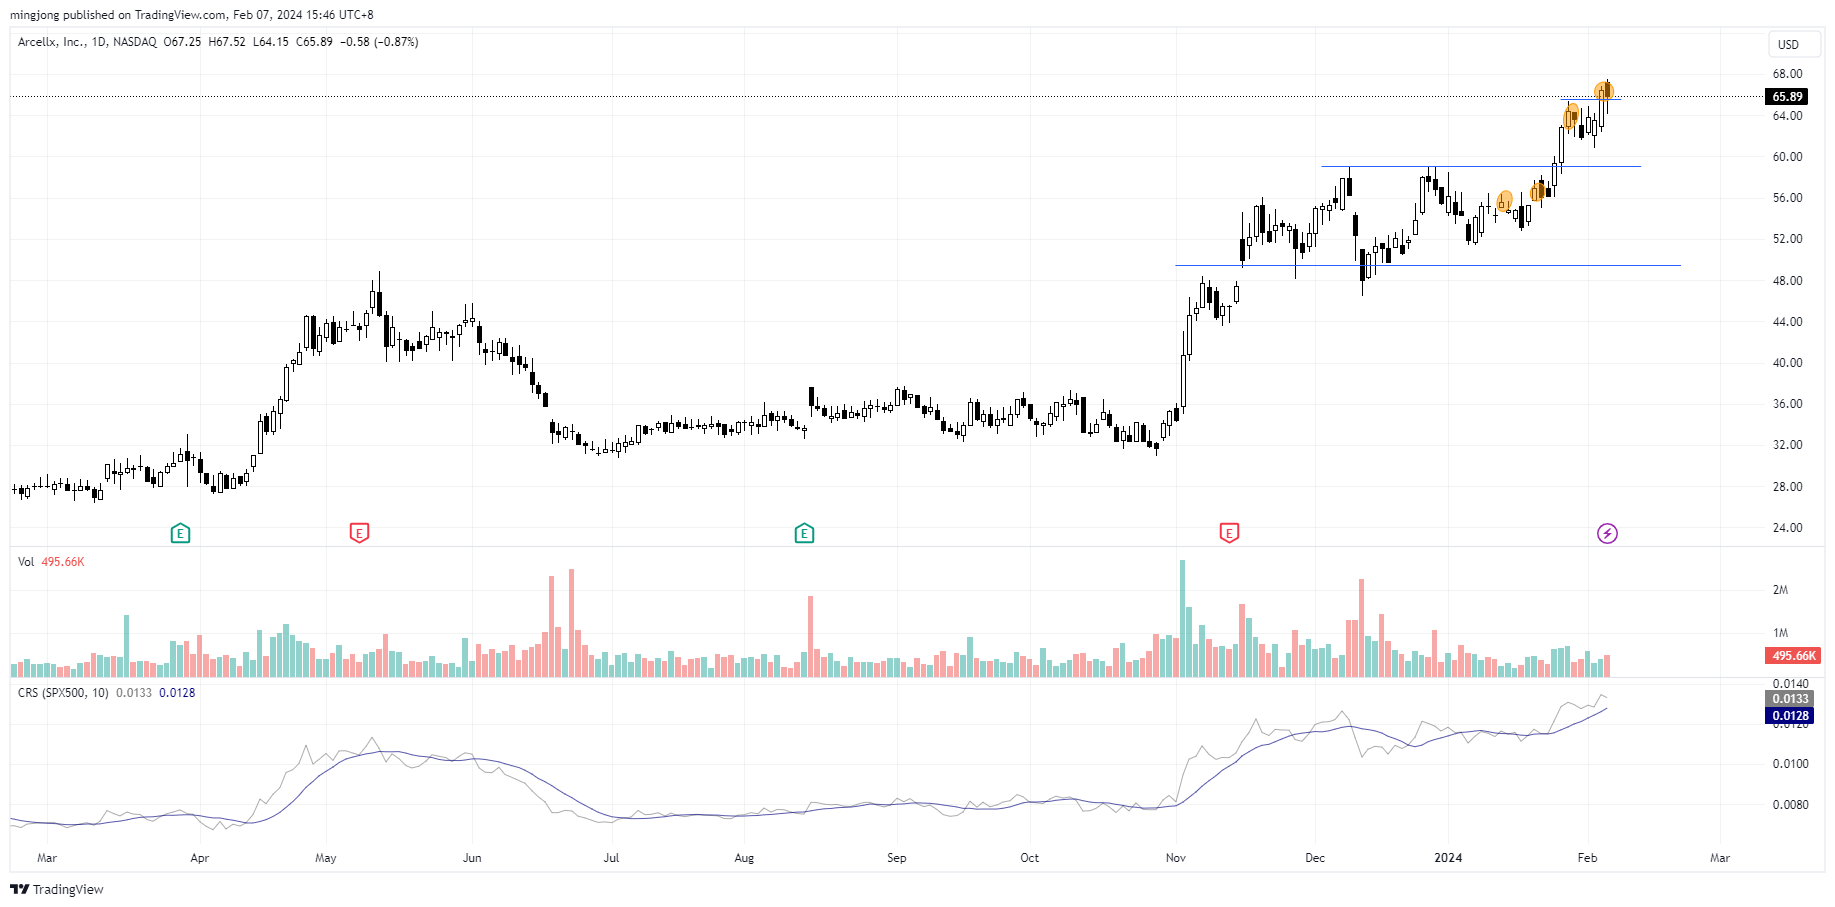
ACLX
Author

Ming Jong Tey
Independent Analyst
Ming Jong Tey has been trading since 2008. He started his learning journey from technical analysis (indicators, Fibonacci, etc...) to value investing. Throughout his journey, he develops an interest in price action with chart pattern trading.


